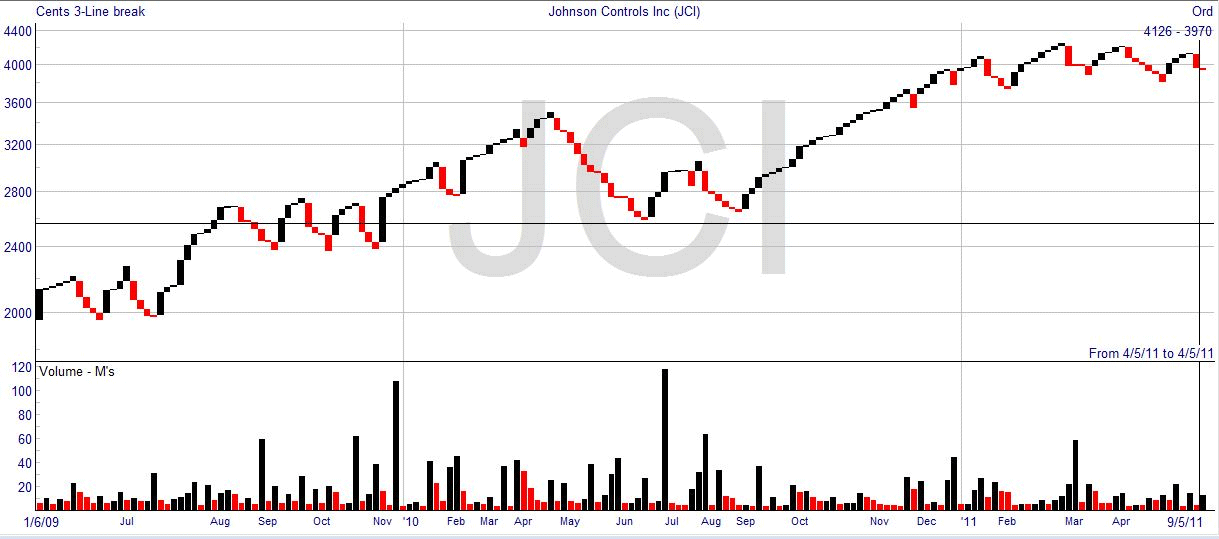
The three line break is noted for being able to show trends reliably. Critics say that it is somewhat slow to confirm trends, which lessens its power for trading purposes. The idea behind the charting is that a trend has momentum and continues until a forced reversal.

The chart uses only one price, which is the closing price, for each time period. Up-trends are shown in black, and down-trends in red in the above example. Each line is only plotted when you have to, so you can go for days without drawing anything.
Assume you start in an up-trend, which means your drawing will be in black. The first line will go from the closing price of yesterday to the higher closing price of today. If tomorrow’s closing price is higher still, then another black line is drawn on the right of the previous, from today’s to tomorrow’s closing prices. If the price isn’t higher, then nothing is drawn. You can go for days without drawing anything.
So what happens if the price starts going down? You can switch over to draw a red down-trend line, but only when the price drops sufficiently. The price has to go below the bottom of the third previous line before you would draw a red down-trend line. It’s called the three line break because it’s the third previous line, you don’t change to a down-trend if the price just drops down to the first or second previous line levels.
Now you are in a down-trend, you start drawing red down-trend lines each day, if and only if the price makes a new low. Otherwise nothing is drawn and the chart stays where it is – that’s why the dates are not evenly spaced.
If you think about what this means, you can see that there would have to be a significant swing in the price for the drawing to reverse, so the chart filters out small reversals and fluctuations in the price. Looking back at the chart, you can see that is why the first line drawn on each reversal must be a long one.
In use, you would only get a trading signal when there was a turnaround, and as you can see that might be a significant length, which would mean that the first part of the move was lost to you. You will close out the position when the next turnaround comes. It gives a strong and uncluttered signal, but only works if there is a strong trend.