Stochastics, or the Stochastic Oscillator, is another indicator of overbought and oversold conditions, and was invented by Dr. George Lane. It works to compare where a stock’s price closes compared to its overall range, on the basis that in an uptrend the closing price will be near the upper end of the price range. When share price is falling, it closes near its low point.
Once you’ll notice straight-away is that there is a %K & a %D on the chart. What’s that about? Well, Lane was experimenting with all sorts of ideas for trading and he lettered them consecutively. It just so turned out that K was the winner! There are actually a couple of types of stochastic oscillator, a “fast” one and a “slow” one. The slow one is smoother, but slower to react. In chart below, %K is the solid line in the lower graph, and as you can see it goes from 0 to 100, just like the RSI. The second dashed line is the %D, and this is a three day moving average of the %K line. It’s used as a signal line at crossovers.

The slow stochastic uses the %D line, as shown above, for its %K, then takes another three day moving average for the slow %D. Don’t worry if you’re confused by that, as the software will sort it out for you.
What does it all mean? The Stochastic Oscillator shows the location of the close price relative to the high-low range over a predetermined time period. The Stochastic Oscillator is a momentum indicator and can be used as a signal trigger when price action is overbought or oversold, or when divergences occur in the signal line.
How does it Work? Stochastics is measured with a %K line and a %D line. The %K line calculates the relative position of the current close relative to the highlow range over the look-back period, multiplied by one hundred. The %D line is a simple moving average of the %K line and is typically set at three periods. The %K and %D line are plotted together and oscillate between values of 0 and 100. The default %K look back period is typically 14, and can be measured in days, weeks, month or even on an intraday timeframe.
The original George Lane stochastic used divergence in the %D line to generate signals the chart: SilVer(USD) from ZignalS.com charting application as the %K line can be volatile. The original George Lane stochastic is referred to as the Fast Stochastic. The Slow Stochastic places greater emphasis on the original %D line; it uses an additional smoothing variable on the %K, again using a 3-day simple moving average, before applying the %D. In effect, the %K value for the Slow Stochastic is the same as the %D of the Fast Stochastic. The Full Stochastic, gives you the flexibility to change each of the variables, from the lookback period of the Fast Stochastic %K to the smoothing variable of the Slow Stochastic and the final %D signal line.

Stochastic values below 20 typically denote an oversold condition and above 80 for overbought. Stochastics at overbought or oversold levels are not necessarily bearish or bullish. In strong trending markets stochastics can remain at extreme values. In the chart above, silver emerged from a base in September 2010. In the early stages of the rally stochastics stayed close to, or above 80 for a number of weeks before the late October correction.
When the major trend is identified, retracements to overbought (for a bear trend) or oversold (for a bull trend) condition can be used as points of entry in the direction of the trend. Again, silver offered a number of buying opportunities, marked by stochastics falling to an oversold condition, most recent of which was March 2011.
Signals can also be taken using divergences between stochastics and price. Silver offered one such opportunity in July and August of 2010 as lower lows in price were not confirmed by stochastics which made sequential higher lows
So what are the signals to look for? In the case of Slow Stochastics, signals can be created by direct crossovers between %K and %D when one or both variables are in overbought or oversold territory. For example, a sell trigger generates when %K crosses below %D after or when %K was above 80.
Divergences between price and stochastics, particularly when prices are range bound, can forewarn of a trend reversal or breakout. Tradingdivergences may mean buying/covering a break of resistance or selling/shorting a loss of support. Resistance and support can be pulled from a trading range, price channel or recent price reaction in a trend.
Stochastics make for better entry than exit signals as a trade may exit just as a new trend is beginning. To maximise a stochastic trade it may be better to employ a trailing stop, such as a parabolic stop or cross of a moving average. Stochastics can also be used in conjunction with Elliot Wave Theory, Fibonacci Retracements or Cycle analysis.
Finally, Full Stochastics offer a great deal of flexibility when it comes to defining settings. Changing %K and %D values will change theirinterpretation. For example a longer %K period may give better signals on crosses of the 50 mid-line than moves in or out of overbought or oversold conditions. It’s yours to try!
Practicalities
Traders can use stochastics in several ways. It can be daunting for inexperienced traders using a simple method of stochastics as they can find themselves being whipsawed in and out of trades. One of the simplest methods of using stochastics is to treat the %K line as a trigger. If the %K line crosses over the %D line to the upside, it is suggested you have a bullish signal. If however the %K line crosses over the %D line to the downside, it is suggested you have a bearish signal.
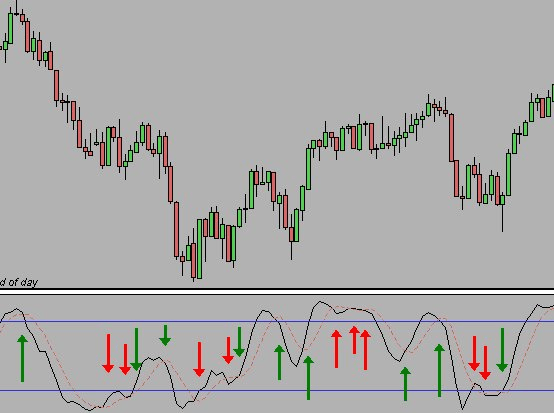
This is too simple of course as you can see from the diagram below. A lot of the times stochastics will cross over, only to cross back the next trading day.
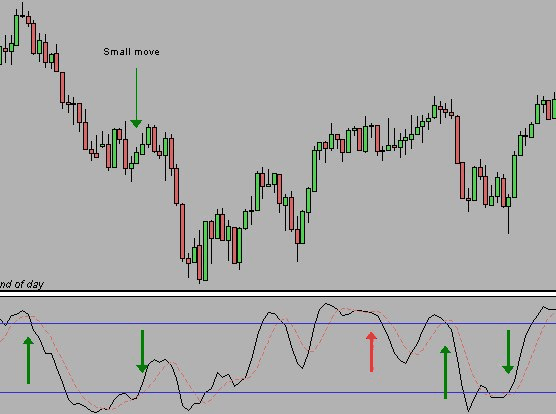
A way to solve this problem is to only trade on the signals if they have reached an overbought, or oversold situation, represented by the blue line zones (the top one is at 80 and the bottom at 20). The idea is to wait for stochastics to reach an over sold situation which is below 20, and then trade when either %K crosses over %D to the upside, or %K crosses over 20 to the upside.
As you can see, the trading opportunities were fewer but more profitable. Out of 5 possible trades, 1 (the first) was significant, 2 ( the last 2) gave decent results, 1 was small and the other a loss. This is not too bad considering we are only using stochastics and no other indicator.
The other dimension to stochastics is divergence. Have a look at how many times you can see divergence on the chart above. Divergence happens quite often in stochastics, and the quicker the stochastics the more likely you are to see divergence. To overcome this problem, I designed a way of reading stochastics that involves plotting two stochastics on your charts.
I designed the system to be used in the forex market, however I feel it works better on stocks, as the stock markets have a definite close of trading, whereas the forex markets only really close for weekends. It is definitely a great tool to add to your toolbox.
Summary: There’s a number of ways to use the Stochastic Oscillator. When it passes up through the 20, this is usually taken as a buy signal, and when it drops down through the 80 it’s time to sell. Also, any time it’s below 20 the market is considered oversold, and above 80 means it’s overbought.
If you are using the crossovers of the %K and %D lines as signals, you would buy when the lines are below 20 and the %K crosses to above the %D. You sell when the lines are above 80, and the %K drops down through the %D. This can be subject to short-term crossovers, so you need to check other indicators to confirm these reversals. Once again, you should watch out for divergences between the oscillator and the price directions.
One thing you may notice from the above that applies to all sorts of oscillators. An oscillator is not much use if you have a continuing trend as it tends to go to the extreme position and hang out there while the trend continues. That’s one reason that you would not take the oscillator going to extreme as a signal for the reversal – you wait until the extreme value diminishes and the oscillator crosses its boundary line, showing that the reversal is likely.

