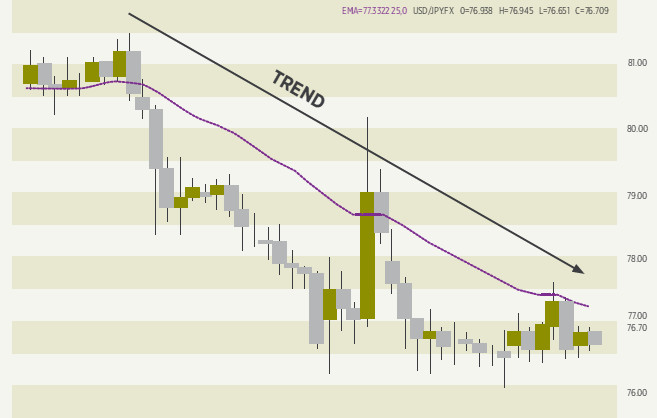
One of the fundamental uses of a moving average is to help you identify which way the price is going, or the “trend”. Traders in such cases utilise moving averages to reduce the noise that price sometimes causes and identify patterns in the price moves when the market is volatile. In fact moving averages are often utilised to determine the trend in volatile markets.

In this case, you don’t necessarily look for consecutive higher highs and higher lows, although most of the time you will find that a definite up-trend conforms with the guidelines we talked of before. Again, one of the most popular forms of betting or trading is to jump onto a trend that is already in motion to take advantage of it.
For example, we might want to call it an up-trend if the price is consistently above the moving average. You can also add to the condition that the moving average slopes upwards. How easily a price complies with these conditions depends on the number of time periods we select for a moving average. You can define a down-trend in the same terms.
Another way to think of an up-trend is that the shorter period moving average should be above a longer moving average, for instance the SMA (10) would be above the SMA (20) if the price was in a strong up-trend. This is easy to see, as the smaller number of periods you take the closer the moving average gets to the actual price. By looking at two different moving averages, you are eliminating times when the price is fluctuating up and down so much that they cross, because obviously that is not a strong trend. In fact some traders use multiple moving averages and take positions based on the fluctuations in relation to one another and real-time pricing.
If you wanted to impose a stricter condition, you might even plot three moving averages and say that the SMA (10) must be above the SMA (20), and also the SMA (20) must be above the SMA (50) as well. This would eliminate the shorter-term price moves.
All these methods are perfectly valid ways to define for your system is that the price is in an up-trend – or in a down-trend if you take the opposite approach. Remember that all you’re trying to do is be sure enough that the price will continue so that you can make a bet on it and win most of the time. So you just want to know that the move is a strong one, which gives you the best chance of it continuing.
Some traders use moving averages to identify support and resistance levels. For instance last year December’s drop below the 200-day moving average for the euro against sterling was noteworthy because it had held since 2007 and when the level was breached this triggered another bear run for the common currency.
Moving Average Triggers
While those methods are okay to be able to say that the price is in a trend, you usually want some sort of “trigger” so that you actually make the bet. Ideally, the trigger happens as soon as there is a sure trend, because the longer you wait before jumping onto the trend the less of it there is to profit from. On the other hand, if your trigger is too sensitive you might find that you jump into the bet and what you thought was a trend goes away – leaving you to minimize your losses by closing the bet quickly.
There are several ways you can use a moving average to trigger your spreadbet. Once you have a basic concept, you will want to play around with the time periods to see what works best for the particular security you are betting on. You can also try out the other types of moving average to find out what works best for you. Just remember that you cannot get perfection, what you are looking for is the best ratio between winning and losing bets to maximise your returns.
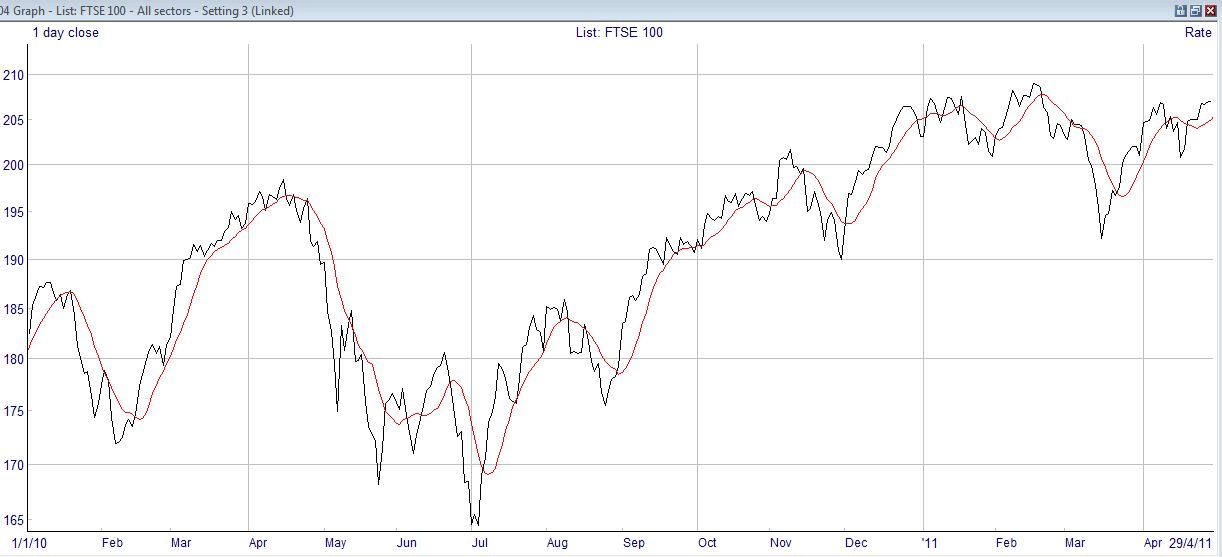
One of the most basic ways to use a moving average is to wait until the price crosses the moving average line, and take that crossing as your signal to place the bet. You would make a long bet when the price passes up through the moving average, and a short bet if the price passes down through the moving average. Let’s look at that chart again of the SMA (10).

You can see that the system will work quite well in finding you good bets, but there are a few places where the price comes back to the moving average line in the middle of a trend, which might cause you to close your bet and even take a bet in the opposite direction. If you take a longer moving average, say an SMA(50), this is what you will see : –

If you were to bet on the crossings of this moving average, you can see that you would miss some of the spikes, and not catch as much of the trend on the moves you did make – but you wouldn’t pick up so many false moves. The longer-term average works better if there are long trends, and avoids the quick changes which are called “whipsaws”, but you will miss more of the first part of any move. That’s why you need to experiment with the period to find the best on balance. Perhaps it might be 25 days? Bear in mind that you are only optimizing on the previous history, so it’s not worth taking it to the nth degree. More than anything, you need to be using a workable system and worry about the details and refining it later on.
Apart from taking a longer time period, you can also deal with whipsaws by putting in some other constraints, which mean you generally don’t bet at the first sight of the crossing. For instance, you could require that the price remains above the moving average for two or more days before you bet, and that would give it a chance to come back if it was a temporary fluctuation, saving you making a losing bet. Another way to look at it is that the price must exceed the moving average by a certain amount, perhaps a percentage of the price or another measure before you trade.
We’ve already talked about the importance of volume in determining the real sentiment of the market, and you can apply that to the moving average trigger. If the price move is real and to be believed, then you are quite right to expect a significant rise in volume when you see it happen. If the volume has not risen or has fallen, then it tends to suggest that the market is not wholeheartedly behind the move that you think you are seeing.
We will talk about exit strategies later, as this section is only dealing with entries – but if you want, you could exit from a profitable trade when the moving average crossed to the other side again.
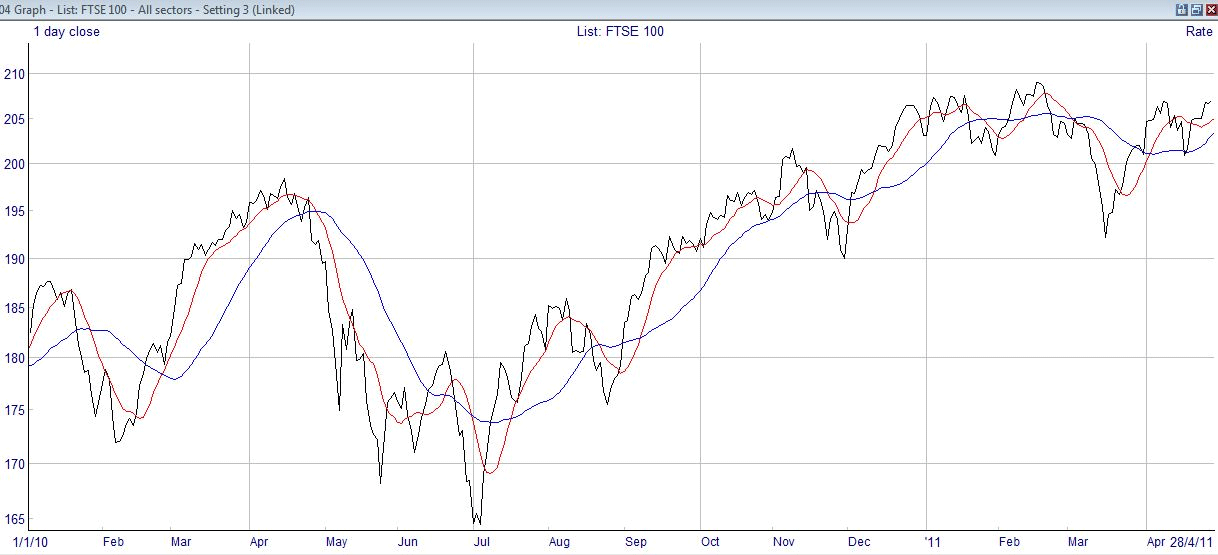
Now, another way of triggering a bet using moving averages. This one uses two different moving averages, and is commonly known as the double crossover method. It was invented to try and overcome the disadvantages of a single moving average, and it uses the crossing of two different moving average lines. Some traders for instance will take the curve of a short-term moing average crossing above that of a longer-term oving average as a buying signal (and vice-versa). Here’s a sample chart of the same financial security with two moving averages imposed: –

The red moving average is an SMA(10), and the blue line is an SMA(30). These are typical values used, but again you can experiment with different pairs. If you think of what we did before, you can see how this might work out better. The moving average line simply smooths out the price line. This means that the spikes in price are evened out, and you don’t get so many whipsaws causing you to bet without gaining. The short period SMA in effect becomes the price line of the previous method, so when the shorter period line crosses above the longer, that is a signal to buy, and vice versa. As a further control, some people also require that the long term average is moving in the direction of the trade.
Looking at the above chart to see how this works, let’s start with the crossing in Feb/Mar 2010. You would either bet straight-away at the crossing, or wait until the blue line turned up, and in either case you get in at around 178. If you close the bet when it crosses back, that’s in April/May at 195, near 10% gain. Taking a short bet at this point would take you back to 176, another large win. In June and July 2010 there are some ups and downs and you would possibly lose a little. The long positions later are well defined, although if you took short positions on the retracements you would again lose a little.
Once again, you should look back on the history of the financial markets you are betting on, and try to pick the best couple of moving averages to give you a net gain. People who succeed at moving averages tend to be those who have done their own research into the periods required for the security they are trading. The double crossover method takes out some of the fluctuations, at the expense of being a little bit later in giving a signal to bet.
Before moving on from simple moving averages, there is a further refinement to this system called a triple crossover method. It works the same as the double crossover method, but provides some confirmation of the intended trade. It is used a lot in the futures market in connection with which it was first mentioned in 1972 by R.C. Allen. The periods used are usually 4, 9 and 18 days.
Once again, if the SMA(4) rises through the other two averages, this is considered a time to buy. But the confirming signal is if the SMA(9) also rises above the SMA(18). It’s only when the nine day average does the same as the shortest term that you can consider the bet triggered. It’s basically just another way of trying to avoid trading on odd fluctuations.
Although you can find some impressive examples of moving average giving you betting triggers, you must bear one thing in mind. The moving average is really unimpressive if you try to apply it to a security that is not trending, or is very erratic. As always, if you are using it in your trading system you want to make sure that you have some other confirmation or signal that confirms you should place your bet.
The problem is that if your chart is not trending, your moving average will be a horizontal line. That’s fine, and confirms that the price is moving sideways in a consolidation, but it doesn’t help you place your bets. The other problem is if you have an erratic price series, where the prices are a long way away from the moving average in the first place. You can get over this to some extent by taking a longer period on the moving average, but as we have seen above this means that you are later to the bet.
The selection of how many time periods to use for moving average is one that has aroused a lot of discussion. There is no one best answer, even for a particular security, as volatility or fluctuations in price can vary over time. For the best response for a trading signal, you need a small number of periods, but you must balance this against the annoyance and costs of more frequent whipsaws. If all else fails when trying to find a good trading moving average, you shouldn’t forget that you can always switch to a different security for your bets. Sometimes some charts just don’t want to cooperate.