This quick review of the types of candlesticks that you may encounter has set the scene for a more detailed discussion of the patterns that you may see. The patterns range from a single candlestick in a significant location to many different candlesticks together, and two or three candles can be combined in a great variety of ways. The power of the candlestick pattern is in how it allows you a glimpse into the psychology of the traders in the market, and to a large extent you can figure this out once you know the basics.
Here’s an actual chart with some patterns notated – we’ll go through these common formations :
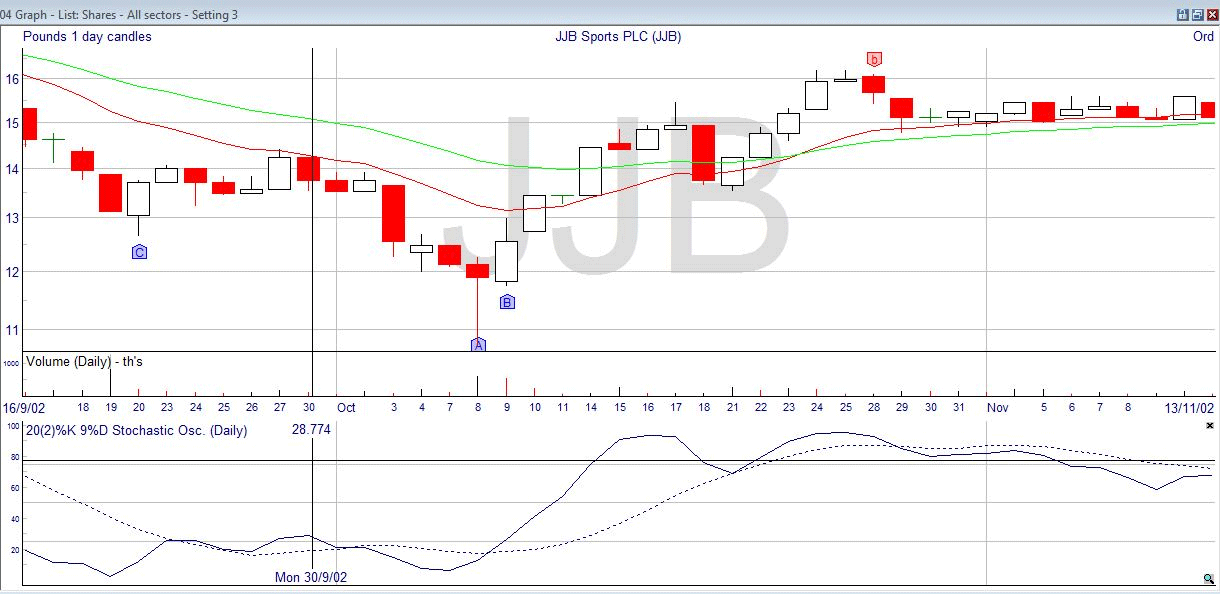
In this notation, the patterns are pointed out with arrow blocks, the bullish ones being blue and pointing up, and the bearish being red and pointing down. The bulls also use upper-case letters, and the bears lower-case.
Starting from the left, “C” is a “piercing line”. This is a two candle reversal signal – some candle patterns are continuation signals. The stochastic indicates an oversold market, and is coming up to penetrate the 20, which is a bullish sign. When you incorporate candlesticks into your trading plan, you will usually use the indicators and oscillators as a gauge of the mood of the market – is it ready for a reversal? – and rely on the candlestick patterns for timing your bet. Here’s the isolated piercing line formation : –
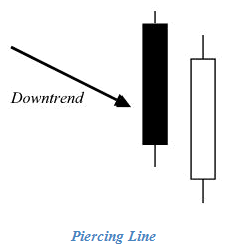
This pattern is described as a black (bullish) candle followed by a candle that opens below the close of the previous day, but rises up to close above the midpoint of the previous day. The price gap down into the second day continues the bearish trend, but this is rapidly overturned by the rally, which suggests that the bears have lost control.
To the right in the chart, you can see a pattern labelled “B” which is another two candle pattern called the “bullish engulfing” : –

It’s similar to the piercing line, but as you can see the second day candle’s real body both goes below the first day candle’s real body, and rises above it. Thus it “engulfs” the previous candlestick. The length of the wicks or shadows is not important, but the longer the body of the second candle, the stronger the signal. Again you can see an aggressive stochastic supporting the reversal message of this pattern.
Interestingly, the candle just before has been labelled “A” by the pattern identification software. “A” is a very common single candle pattern called a hammer : –
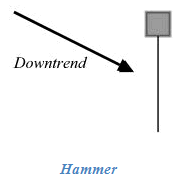
The hammer is a candle that has a small body, with a lower shadow at least twice as long as the body. There is no or a very small upper shadow. The hammer can be either white or black, which is why it is shown as grey above, and it occurs in a down-trend. You can compare this to a dragonfly doji, which is also a reversal signal in a down-trend.
So in the original chart, when you saw the hammer and a rising stochastic you would already be prepares for the reversal. With the hammer, the reversal would be confirmed as soon as you saw the bulls taking control on the following day, and that is when you would place your bet. The hammer is a more powerful signal if there is gap down from the previous day (not quite, in the chart), and if there is a spike in volume (which there was).
The psychology that makes this work is that the market is in a down-trend and has been moving down for some time. Investors are concerned and are considering whether they should hang on in hope or get out. When they see the sell off during the day they all panic and pile in to get rid of their holdings, and this pushes the price down temporarily. But the smart money sees an opportunity in this, and starts buying, pushing the price up to where it started by the end of trading.
Apart from the appearance of the candlestick, it is called a hammer by the Japanese because they talk of it “hammering out” the bottom of the market.
Moving now to the middle of the chart, you can see what is nearly a gravestone doji under the “JJB” of the name. There is a short real body, so it is more strictly called a shooting star, named for its appearance. The real body can be either colour, and in this case it’s white. The reason that the software didn’t pick it out in this case, I think, is because the following day started marginally higher, which is usually taken as a lack of confirmation of the reversal. However, you can see that the stochastic was shooting down through the 80 line, and that the next day finished up as a long bodied bearish day. The down-trend didn’t last long, and you can see that the stochastic soon reversed and came back up.
The feature that you are looking for in this pattern include that there was a definite up-trend, and the upper shadow should be two or three times the length of the body, at least. There should be no lower shadow, and the following day should show continued selling and a lower close. The gravestone doji and the shooting star have similar psychological implications. Investors jump in on a white candle before the shooting star, and smart traders realize that the price is sustained by greed, and close or short their positions, which gives the long shadow on the shooting star day. From there, it is a matter of the downward trend being confirmed on the subsequent day.
The last identified pattern on this chart is the “b” on the right. This is a bearish sign, which you can probably see is the equivalent of the bullish engulfing “B” but in a downward direction. It’s called the bearish engulfing. Most of the candle patterns that you see have bullish and bearish versions, just by inverting them.
Here’s another section from the same security : –

You can see two “G” pointers, one in lower-case signifying a bearish reversal, and one in upper-case. This is the shooting star, which should end a down-trend and reverse into an up-trend. Even though the next day was up, the slide down continued after this, so the candle did not work. You can see why it might not have worked, as the stochastic, while a low value, was still heading downward. The other interesting point is how the volume increased on the bearish moves, indicating there was strength in that direction.
Compare this to the lower-case “g” on the left, which is called an inverted hammer as it occurs in an up-trend and is the reverse of the hammer pattern. This worked well, and the stochastic in copy book fashion was high and coming down through the 80 line, showing the overbought nature of the security and the likelihood of reversal.
Our final example of an actual chart shows the “harami”, a Japanese word meaning pregnant. It is a two candle pattern, with one long real body followed by a short real body, making it look like a mother with a baby bulge: –
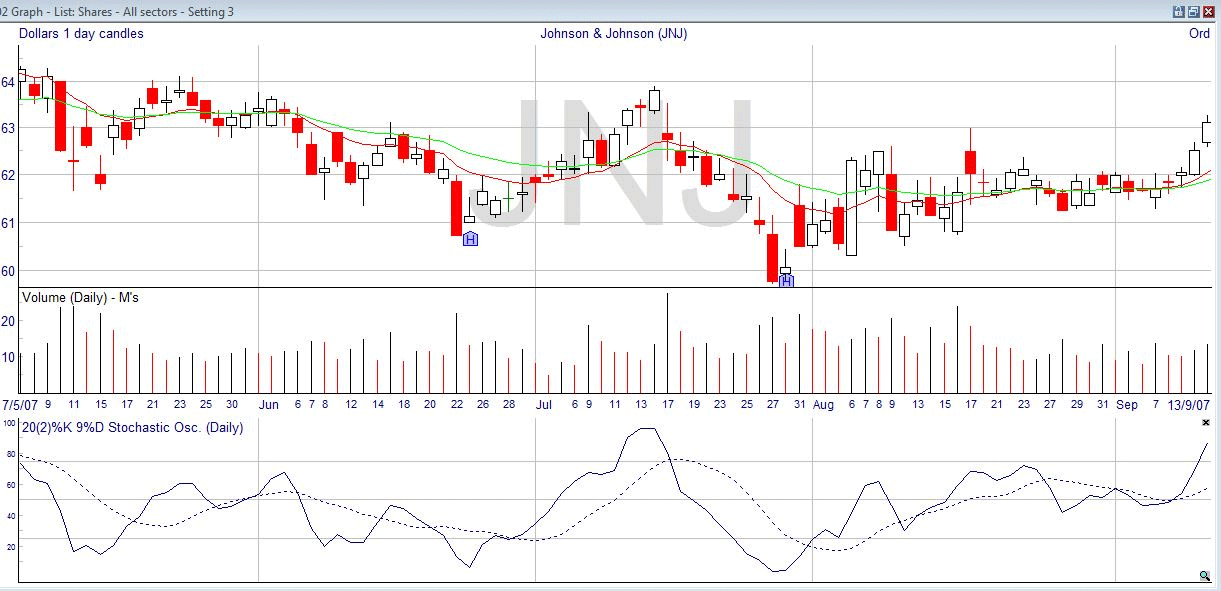
The harami is called the same whether it occurs in an up-trend or a down-trend, except it would be called a bullish harami or a bearish harami. Above in you see two bullish haramis, marked with the letter “H”. When a harami occurs in a down-trend it indicates that the selling has stopped, and when it occurs in an up-trend it indicates that the buying has stopped. You can identify the bullish harami from two parameters – the price must be in a definite down-trend before it occurs, and the second day’s real body must be white and completely engulfed by the first day’s black or red body. The wicks are not important.
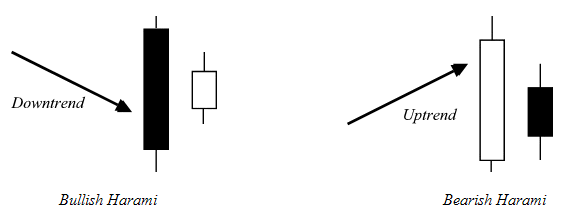
The psychology of this powerful signal is as follows. As usual after a long decline, novices are panicking and unloading their stocks, making a long black candle. However, perceptions change overnight and the smart money starts moving in on the stock, creating a gap from the closing price and a rising price during the day. The strength of the bulls allows the close to happen higher, and the higher it is towards the top of the first candle the more powerful the signal (the two examples above are not very high against the first day’s opening level). However, it is enough to make the bears nervous, and if any are in a short position hoping that the down-trend will continue they will buy to cover on the next day, increasing upward pressure on the price. You can see that both the examples in the chart above include following days that jumped significantly to their opening price.
You now have a basic grounding in recognizing candlestick patterns. You must always remember that to be effective they must occur in the right place, which is in a strong trend, and with an indicator showing that the market is favouring a reversal. Although you lose some information when you do it, you can always break down more complex patterns into fewer candles by combining them, so that you have a better understanding. After all, the start and end of the trading day are arbitrary places in the continuum of price movement, and that you can think of combining candles as, for instance, having “two day” candlesticks. You just have to plot a candle on the basis of the starting price of the time you’re looking at, the final closing price, and the maximum and minimum prices achieved in between. Here’s an example of the bullish engulfing formation: –

The opening price for the two day period is the top of the black body, and the closing price of the two day period is the top of the white body, the maximum and minimum prices are those achieved by either candle, so the end result is the candle on the right – the bullish engulfing on the left has become a hammer (remembering that this is in a down-trend), both of them signalling a reversal. One more example: –

Here a dark cloud, which appears in an up-trend and is the bearish version of the piercing line, has been combined to produce a shooting star.
Many books have been written about candle patterns, but this short introduction should have given you the idea about how to analyse them. It is never sufficient to bet on the basis of the candle pattern, you must always have corroborating evidence from another indicator or oscillator that a reversal is likely. Candlestick patterns can also indicate continuations, but this is much less used, probably because trends are assumed to continue until stopped so there is often little extra information to be gained from finding an indication that shows a continuation.