The recognition of support and resistance levels on a stock chart is an integral part of technical analysis. The concepts are simple but very important.
Let’s look at what support and resistance levels are and how to use them…
What is Support?
“Support” is a level on a stock chart that represents a zone where buyers won’t allow the price to go any lower. Of course the price can always go lower, there are no absolute certainties in the stock market, but the probabilities aren’t in favor of the price breaking below a support level. If a support level is broken then perhaps the trend is changing to the downside.
Keep in mind that the markets work on “supply” and “demand”. When demand exceeds supply, prices go up. When supply exceeds demand, prices go down.
So, support levels occur where buyers are stronger than sellers.
 The stock chart above displays a support level at approximately $1.25. The breakdown below that support level that occurred in May 2010 resulted in the stock price moving lower.
What is Resistance?
“Resistance” is a level on a stock chart where prices have trouble breaking through. If the stock does eventually break through a resistance level it’s a bullish sign.
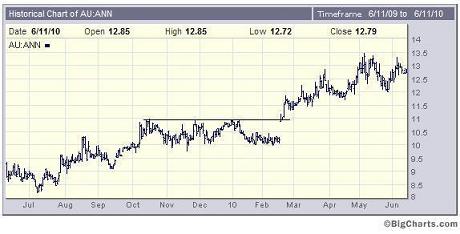
 In the stock chart above the resistance level is located at approximately $11. The breakout above this resistance lead to a profitable rally.
What makes a support or resistance level valid?
The more times a support or resistance line is touched by price, the more valid it is. Also, the longer the level has existed, the more valid it is.
Breakouts above valid resistance levels are significant events. They are a bullish sign indicating the likelihood of the stock price moving higher.
Similarly, breakdowns below support levels are significant events. They are a bearish sign indicating the likelihood of the stock price moving lower.
How can a knowledge of support and resistance levels benefit you as a trader?
If you can identify valid support and resistance levels on a stock chart, you are able to make trading decisions based on better than average probabilities.
Careful analysis of any stock chart will reveal that support and resistance levels define the trend. A trend is made up of peaks and troughs, of which support and resistance levels form an integral part.
The identification of support and resistance levels when studied alongside the dominant trend of a stock can give you a valuable clue as to the stock’s likely next movements.
Some examples of how support and resistance levels used
If the stock price breaks down below a support level then it is likely that the uptrend has run its course and a downtrend may be imminent. It follows then that setting stop-losses a few percent below support levels may be a good stop-loss strategy for a trend trading system.
Some trading systems specify entering trades at a support level. This can make for a low-risk entry. It means that you are able to set your initial stop-loss closer to your entry price and in doing so reduce your risk.
If a stock price is at an all time high then there is no overhead resistance to potentially slow down the stock’s upward advance.
As we’ve already discussed, support and resistance levels can identify changes in trend direction (i.e. breakouts above a resistance level – uptrend; breakdowns below a support level – downtrend).
Some trading approaches plan to buy at support levels and sell at resistance levels. This might be a valid way to trade sideways markets where the price bounces up and down between support and resistance levels. In a trending market though, a trend trading approach would be the preferred way to go.
Breakout traders enter a position when the stock price breaks out above a significant resistance level. They might also insist on the stock’s volume rising when the breakout occurs to give them some confirmation that the price is likely to go higher.
Once a breakout occurs above a resistance level, this prior resistance level becomes a support level.
Conversely, if a breakdown below a support level occurs, the prior support level becomes a resistance level.
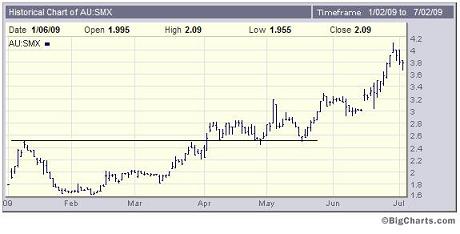
 The stock chart above displays how a resistance level can become a support level once penetrated. Notice how the price breaks out above the resistance line in April 2009 and provides a floor for stock prices going forward.
Summary
- If you analyze support and resistance levels on a stock chart, you increase your ability to make effective trading decisions
- Breakouts above resistance levels are significant events
- Breakdowns below support levels are significant events
- Look at support and resistance levels in conjunction with the dominant trends of the stock – moving averages can make this easier.