Candlesticks in trading have two main purposes;
One is to tell the trader the open, low, high and closing price of that particular time period, and two, whether the close was higher (green bodied), or lower (red bodied) than the open.
However they can alert the trained eye to pending reversals offering the chance for a trader to get a head start on a possible new trend, or to alert the trader who is already in the markets that the trend is ending and to tighten stops or take profits now.
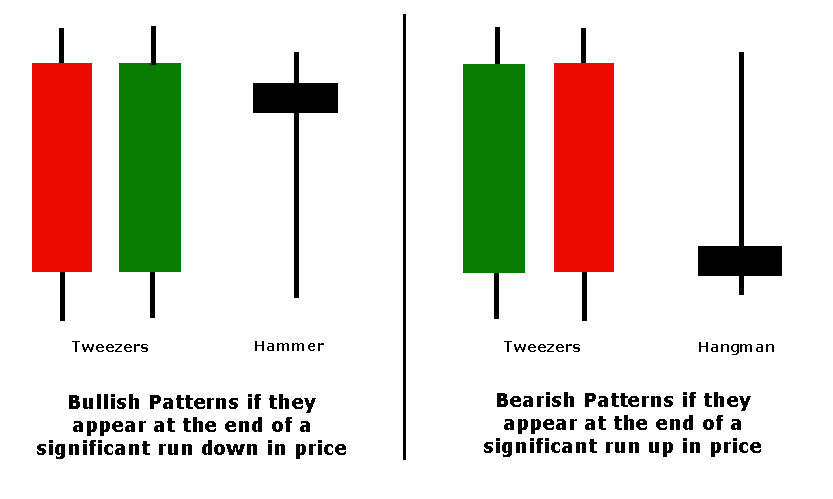
The two candlestick patterns we are demonstrating here is the hammer (& hangman), and the tweezers (also known as railway tracks).
When looking at either pattern, they look quite different, however when it comes to what is going on in the market place, the same thing is happening. So let’s see what that is.
After a significant run up in price, the market will exhaust itself or be overbought; however this is when the most action usually takes place. The reason is because towards the end of the trend, the misinformed public are still buying, not wanting to miss out on what is probably a well talked about market and trend. However at the same time, the professional traders are the ones selling to the misinformed public.
This activity creates a resistance to any higher prices because all the late buying is being absorbed by the professional selling. On a candlestick chart, this will often be shown by either a bearish pair of tweezers or a hangman. Essentially price moves up and then moves all the way back down again, in the space of one or two candles (see diagram below).
Likewise, after a significant move down the market will exhaust itself or be oversold; the misinformed public are the ones selling because they can’t handle their losses anymore, and the professionals are the ones buying from them.
Again, this activity creates support for price and the candlestick patterns will show price move down and then all the way back up again. This is shown by a bullish pair of tweezers or a hammer.
The bearish tweezers pattern and the hangman show the same activity, price moves up, and then moves back down roughly the equivalent amount. The bullish tweezers pattern and the hammer show the same, price moves down and then moves back up roughly the same distance.
If you look at the diagram below, you’ll see this in action. The main difference between the tweezers and the hangman or hammer is the time period. The tweezers are two candles, but the activity is the same. The other difference is that the colour of the hangman or hammers body is not relevant because the open and close are very close to each other.
Two things that make these candlestick patterns more powerful is when the range of the candles are longer than the average range, and there is higher than average volume to go with it.
