Triple Top and Bottom Reversals
This pattern is very similar to the head and shoulders pattern, but as the name suggests, all three peaks are at roughly the same height. The analysis is basically the same, and this pattern is not seen very often. It is important to check the volume of each peak to see if the trend is weakening. Otherwise, three peaks at the same height could just show a sideways trend with no reversal to come.
Double Top and Bottom Reversals
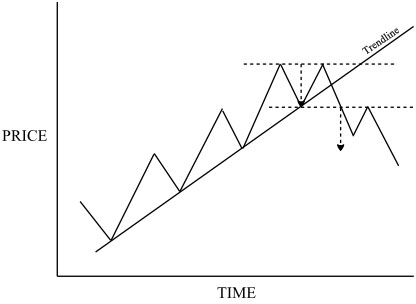
This is much more common than the triple top and bottom, and it is almost as common as the head and shoulders reversal pattern. Because of the shape, this is sometimes referred to as an “M” top, or a “W” bottom. Here’s an example of the double top:

After the second peak, the price drops down through the trendline which tells us that the trend is altering. It’s only when the price drops below the previous low point that the pattern is formed, and the reversal is likely.
It is easy to get confused into thinking a double top or a double bottom is happening, when it is simply a hesitation in the trend. After all, each peak is a potential resistance level, so if the second peak stops there it is not an unusual occurrence. Most of the time, trends tend to continue rather than reverse, so you should be careful not to rush to the wrong conclusion. The clue is to see that the previous low point is violated strongly, so that you can see a reversal is happening.
Other Reversals
There are other named reversal patterns, and not all reversals are clearly marked. One of the bottom reversals, going from a downtrend to an uptrend, is called a saucer, or rounding bottom, and this is just a gentle curve which may take months or years to form. It does not really offer a trading opportunity.
A spike reversal is just the opposite. This is a sudden switch in direction with hardly any time for the transition. This might be caused by a major announcement, such as a new drug being discovered by pharmaceutical company, or a problem being found with an existing drug which means it must be pulled off the market. Spike reversal can also happen when the market becomes very overextended in one direction or the other, and you can see this with a technical indicator, as discussed previously.