The trend is your friend is one of the first things that are often heard in technical analysis and that has been thrown around for years, but is in fact one of the most valuable terms in trading. Most of the time you want to be trading in the direction of a trend. This has the better odds of success. Because of retracements, or setbacks, in the price, it is not as easy as just finding a trend and betting on it continuing, but that certainly is the starting point for many trading plans. While you may think that you can recognize an uptrend or a downtrend just by looking at the chart, technical analysts have defined what constitutes a trend so that they can consistently identify it.
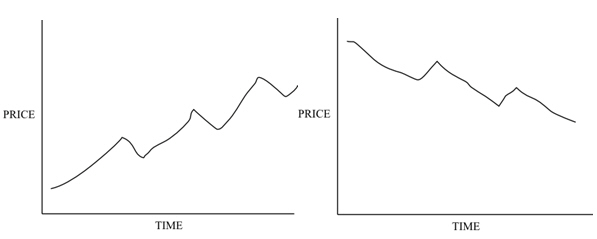
Here is a freehand sketch of an uptrend, and one of a downtrend:

The definition is that an uptrend has successively higher peaks and higher troughs in the price; a downtrend has successively lower peaks and troughs. If the peaks don’t keep moving in the direction of the trend, or the troughs don’t, then the trend may be finished. But it’s important to note that about 40% of the time equities or markets trade sideways, and are not in an uptrend or downtrend.
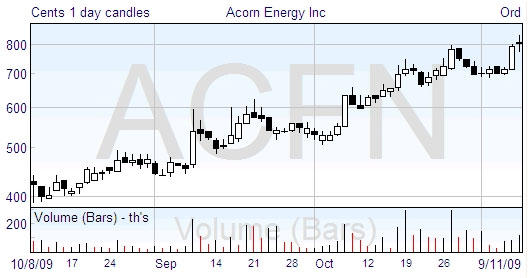
Even with this definition, whether the market is in a trend and even the direction of the trend depends on the timescale that you are considering. A primary trend may go on for years, but within that time there will be many retracements, so if you look for example at a chart showing one month in that time span, you might see the opposite trend. This doesn’t really matter, as long as you realize that you can learn a lot from looking at different time scales, and when you trade you look at the one appropriate for the type of trading you’re doing. For example, here’s a candlestick chart of Acorn Energy Inc

Most people would consider that this shows a clear uptrend, but note there are three places where there are two week periods of retracement. So you must make sure that the timescale you look at matches your trading strategy.