For relatively short term moves in prices, most traders concentrate on technical analysis, and that is what we will do in this guide. The basics of technical analysis were laid by Charles Dow, of Dow Jones fame, at the end of the 19th century, and that is perhaps all the history that we need to go into. Dow studied and reported on various aspects of the stock market, and developed some general ideas which are still used today.’

Any monkey can draw lines on a chart, and you’ll find loads of so-called technical analysts affiliated with societies or offering trials or other gimmicks to get you to sign up with their service. Don’t bother!
“Technical analysis and trading chart patterns works because human behaviour is repetitive and predictable, permitting historic price patterns to be used to forecast stock price movements for spread betting in the future. “
Without doubt, if you do not utilise technical analysis in your financial spread betting you may be missing out on important aspects revealed by chart patterns and trend data. This is because technical traders take a very quantitative approach to spread betting, using past facts and figures to determine future stock price levels along with potential support and resistance levels. But what is technical analysis exactly? Technical analysis is the study of “market action”, which is actually all we know about the performance of a trading market at any moment in time. Market action is simply “how much” and “how many”. How much is the price at which a trade happens, and how many is the number of shares, or contracts, or whatever the unit we are dealing in. Technical analysis interprets market action, and from it allows you to project the probable future.
“We find a lot of traders and investors will have a view of a share, but they might want a bit of support of confirmation for what they’re going to do, or they might want to have trading ideas generated for them. This is where technical analysis can prove helpful.”“However it’s dangerous to use charts as a crystal ball but better to use them simply as a guide to set entry, stop and exit. The financial charts can’t predict climate, pandemic, geological or political events that could change the entire global economy.”
One truth about trading that you should get clear from the start. No one has ever developed a system, or a calculation, which will allow you to predict with accuracy where a price is headed next. Trading of any type, in this case through spread betting, will have both winners and losers. The way to profit is to make sure the winners grow as much as possible, and to cut off losing bets as soon as it becomes clear that they’re not going to work out. Of course, you use technical analysis to try and tip the odds in your favour, but you have to learn that having some losing bets is part of the overall scheme, and does not mean that you have necessarily failed or done something wrong. It’s good practice to review completed trades to see if you did make any mistakes, but losers will happen even if you didn’t.
Technical analysts seek to disregard the market noise created by news flow and concentrate solely on the price action as show on the charts. In fact there are three basic principles used in technical analysis. The first is that “the market discounts everything”. What this means is that the action of the market reflects everything that there is to know about the price. The reason this is important is that technical analysis depends on the premise that we can learn what we need to know just by studying market action.
“Most spread traders will use technical analysis to trade. There are not many fundamental traders using spread betting. Since spread trading is mainly short-term, most traders will look at short-term indicators. Technical analysis is a statistics-based approach that can help traders minimise losses while maximising gains. The price action provides an insight of human behaviour and sometimes this can be predictable.”
Now there are many things that can affect the price. Some of these were mentioned when talking about fundamental analysis. How well products are selling, whether they are the next big trend, if government is going to regulate or stimulate the industry, all can have an effect on the share price. The great thing about technical analysis is that you do not have to find out all these details – this first principle says that all of them are already included in the price! That’s right. Technical spread bettors in general believe that all the data they need on a market is built into a stock market’s price movements. This removes the need for any financial reports, economy news or other fundamental data, as from a technician’s viewpoint these are all already reflected in the price.
It might seem that this is an oversimplification, but all it really means is that supply and demand in action is setting the price, and that is a fundamental truth of economics. Technical analysis is made much easier because of this principle.
The second principle is that “the market exhibits trends”. If the stock price is rising steadily, it will probably continue to rise, and this is called an uptrend. If the stock price has been falling for a while, it will keep dropping and this is called a downtrend. It’s really like Newton’s laws of motion – a body in motion will keep on going unless acted on by an external force. If there is no reason or external force making the trending price stop rising or falling, then why would it?
Of course, trends do not go on for ever, but many trading schemes are based on following a trend while it lasts. That is why traders have a saying “let the trend be your friend”. Two points to note about trends – an uptrend does not go straight up, but has little setbacks, called “retracements”, on the way, and the same thing happens with downtrends; and prices are not always going up or down in trends, but sometimes they fluctuate around the same position, which may be called “trendless”, or trading sideways, or range trading.
The third principle is that “history repeats itself”. Put simply, people don’t change, and price patterns and market actions that repeat often lead to the same result. A certain set of circumstances repeated will lead us to expect the same thing will happen again, so we can for example look for sets of circumstances, see what the outcome was in the past, and reasonably suppose a repeat occurrence. Naturally, the result is not certain, but trading is a percentage game.
Technical analysis in spread betting relies purely on spotting trends in past historical data, such as past prices and trading volumes. Since technical analysis is based on statistics it lends itself to charting applications and works across spread betting time frames of all lengths, making it popular with the ever increasing number of investors and day traders who spreadbet on minute-to-minute market movements.
“A little knowledge IS a dangerous thing and once one starts with technical analysis it’s easy to get analysis paralysis. It’s also fair to say that there are hundreds, if not thousands, of different ways to use the indicators/charts and all of them work some of the time. The best analysts will make the most money…just like the best clarinetist gets to be a principal/soloist.”
Basic Charting
It may not be your most favourite subject, but if you are going to learn technical analysis you need to deal with mathematical concepts like graphs and charts. Fortunately, computers and the Internet mean that you do not need to pore over numbers and draw the charts by hand. The computer can produce a nearly infinite array of charts, showing various aspects of market action for many different financial instruments and charting software packages are now readily available to help traders make market analysis a matter of matter of minutes, rather than hours – a potentially critical advantage in the fast-moving markets of today. Such software makes it easy to calculate things to be added on the chart, which help us determine where the price is likely to go.
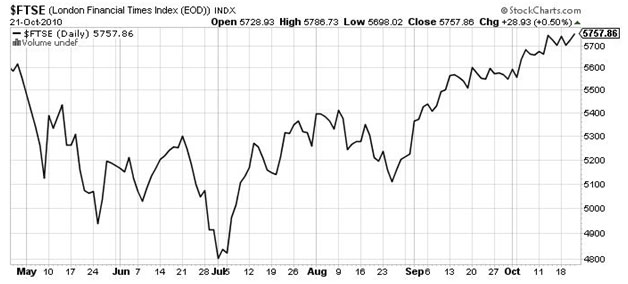
The most basic type of chart includes a timescale along the horizontal, and a price going upwards. The timescale can be measured in minutes, hours, days, weeks, months or even years. Often charts are produced with daily prices plotted, and here is an example:

For each day (five trading days per week) the price of the FTSE is plotted, then the points are joined up with a line. This chart is from www.stockcharts.com, which provides free access to many charts, and there are several other websites such as MSN and Yahoo that have financial sections where you can refer to these historical prices.
A chart such as this gives some information, but it is very limited. It is certainly hard to see a way in which you would project where the price will go next. The next level of information is to look at the range of prices that were seen during each day, or other time period. With trading taking place all day, four prices are easily available – the opening price on the first trade of the day, the closing price on the last trade of the day, the lowest price that occurred during the day, and the highest price.
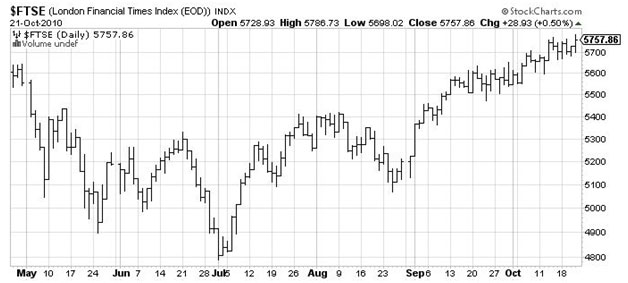
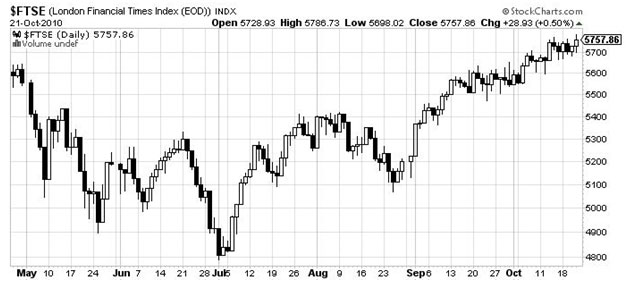
There are two conventions used to show this additional information on the same size chart. One is called a bar chart because the prices are represented by lines, or bars; and the other is called a candlestick chart, because symbols that look like candles are used. Here are both types of chart, showing the same time period as the last one, but including more information:


These two types of chart show exactly the same information in slightly different ways. In the bar chart (top) each vertical bar, one per day, stretches from the lowest price to the highest price on that day. The opening price is represented by a little horizontal line, called a tic, poking out to the left, and the closing price is shown with a tic to the right.
On the candlestick chart, at the bottom, the high and low prices are again denoted by a line between them for each day. This single line is called a wick or shadow. But over that wick, stretching from the opening to the closing price, is the body of the candle. You will see that the body is either black or white, and this signifies which price is the open, and which is the close.
When the price is generally increasing, and the closing price is higher than the open, then the body is white, or shown in green on some coloured charts. When the price is generally going down, and the closing price is less than the open, then the body is black or sometimes red. You can see that the price action is easier to follow using a candlestick chart rather than a bar chart, and so it is the one that is generally used by traders nowadays.
That is the general form of chart that you will be looking at and using when you apply technical analysis. Things will be added to it, as you’ll see in the following chapters, which will help in determining which way the market is going. Also you will learn to see patterns in the movement of the price which suggest the next move.
As shown the chart only depicts “how much”, but the volume of trading can be added, usually along the bottom, to show “how many”. For stocks, the volume is easy to determine. For other financial instruments, sometimes the volume cannot be discovered – for instance, the Forex market is widespread, trading in many different countries, so there is no cumulative trading volume available.
“Traders look at charts and use screening software to filter and decide on a market direction. However, at the end of the day you still have to spend screen time eyeballing charts. There is no substitute for time spent in front of a screen!”
Practical Trader Example of Why Technical Analysis is so Useful
How many fundamental analysis traders are rich? There is an old market adage that says that ‘fundamentals tell you what, and technicals tell you when’. Charting helps give me a reason for entry and exit..example around 39p I’ll bail, if we can take out resistance at 46p and then at 50p I’ll add.

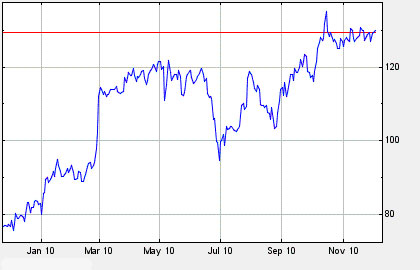
Someone asked for my views on Rank….in short stay long for target of 145p..but expect a challenge on the 122 area. Charting tries to predict repeated human behaviour and has worked very well for Rank Group PLC… have a look at the chart and notice how the trading range break becomes the new target and how resistance is tested 3 times before the move and then becomes support.
Note: All charts take a fair bit of interpreting.. They can only predict the future based on their sampling of the past and if there’s one thing that the recession underlines it is that the hundred to one chance against sometimes comes up and slaps you down hard. My advice would be to teach yourself and not to use any charts you don’t understand or rely on other’s interpretations of what they say (mine included). So, if you’re new to shares and especially to leveraged trading, follow the action and run a fantasy portfolio until you are confident that you understand all the wrinkles. Never risk more than you can afford to lose and always remember that any money you walk away with, any profit you make, is from someone else’s loss or mistake.
Learning and then applying technical analysis takes a lot of time, patience and practice like any other skill worth acquiring – I started off as a technical analysis sceptic, but after trading for a while found more and more value in it, so I educated myself in the dark art, so I had another way of assessing stocks in addition to my traditional research based approach. Chartists have losing trades like every other investor, just not as many losing trades as non-chartists, who throw darts at the calendar in order to determine entry and exit points.
Spread Betting: Technical Analysis vs. Fundamental Analysis
Technical analysts (and indeed fundamental analysts) are not able to predict the future. However, we can still make observations of the condition of the markets, based on current and historic data, and identify the current state of investor sentiment. This is generally the main driver of stock prices.
Let’s now think about the limitations. Let’s say the FTSE 100 is heading for 4500 something, we should find FTSE 100 spreadbetting support there. ‘Fundamentals’ or should we say ‘mentals’ have come into the picture.
This is when technical analysis tends to suck. Whether for spread betting, CFD trading or DMA trading. Unexpected ‘worldly events’ can spook markets, these include terrorist attacks, assassinations, and er, economic woes. It’s best not to think about it too deeply, just wait for the market to stabilise a bit and then get back to proven methods of spread bet technicals.
Technical analysis training is important so as to assist spread trading in spotting trend as well as key support and resistance levels in different markets. While the pros and cons of utilising technical analysis and charts are often a hot topic amongst traders, from a risk management perspective and for identifying suitable entry and exit points for trading strategies, technical analysis is definitely an important element of any experienced trader’s strategy. Identifying the direction of a trend – whether it be short, medium, or long term – is a relatively basic tool that allows you to better time your trades. From a trend you can identify key levels of support and resistance and place your trades accordingly.
“Spread betting providers definitely have many active traders, whom you would consider day traders, because they are in and out of shares a lot of times during the day, looking to make anywhere from $200 or $5000 to $10,000 on one successful trade, but I would say that even the day traders are not relying exclusively on their charts, they’re also looking at the underlying information on the company”
To conclude technical analysis is fast becoming the choice for new and experienced traders alike and learning to read charts in a simple, clear manner is important in today’s marketplace. Technicals are especially important for spreadbetters who are looking to trade very short timeframes. Of course I recognise that there are difference strokes for different folks but technical analysis and fundamental analysis do not necessarily have to exclude each other and in fact this a third way for analysing spread betting markets. Fundamental and technicals can be used in unison, taking into consideration current events as well as the historical form, although it is more common for a spread bettor to select one over the other.
- Fundamental analysis tells you what the markets should be doing, which is good for the long-haul view.
- Technical analysis tells you what the markets are really doing, which is excellent for the short-term to medium term view.
- This document is concerned with technical analysis and therefore the short-term view. Everyone has different opinions. If they didn’t there would be no market place.
You have got to decide what trading strategy you will utilise. Do you prefer to trade / bet based on fundamentals or will you take technical signals off a chart, or a combination of both? For fundamentals Digital Look is a good source and has a lot of information available for free. For technical signals then you should read books and browse through a few trading journals. But unless you know clearly what strategy you will be using, don’t bet real money or you will lose it.
Using a combination of the two different methodologies makes sense particularly given the importance surrounding some economic releases, such as GDP, the Consumer Price Index and decisions reached by central banks. For myself, I prefer to base my decisions on fundamentals and then wait for the charts to confirm. In other words I tend to prefer to check the fundamentals behind a share before trying to predict which way it is likely to head. Fundamental analysis is useful for assessing economies and to examine individual company data to determine the value of a company, whereas technical analysis works solely on price movements and volumes of trades. Technical analysis in this respect is useful to help pick up appropriate entry and exit points.
“As a City Index spokesman put it, in financial spread betting, spread traders who open trades without utilising either fundamental or technical analysis might be regarded the equivalent of the pedestrian who crosses the road without first looking both ways. Spread betting is already risky; why make it more so?Technical analysis is based on looking to the past for potential indications of the future. Given this reasoning, some spread traders might have considered that the last time Chancellor George Osborne announced budgetary cuts – 24th May this year – sterling immediately dived in relation to the dollar and the FTSE 100 fell to an eight-month low of 4939. However, this time the pound rose against the dollar and lost ground against the euro. This is the main limitation of technical analysis in financial spread betting; it is only an indication of what has happened, not what is happening or what is going to happen.”
Parting Note: Using fundamentals and technicals in tandem can help develop a strategy that is repeatable, simple and effective for your psychological trading profile. And if you are serious and want to make money spreadbetting then you have to develop your own understanding of technical analysis, when to use it, and when to ignore it. One thing I’d wished I’d learnt at the start was more technical analysis. Because no matter how good or bad the share is, long or short. It don’t mean a damn thing if the market is not going in your direction. The more charts you look at the better you become…and I prefer looking at charts as opposed to using a scanner to spot the right patterns. Reasons being a) the more charts you look at the better you come at reading potential movements, b) I love it…it’s a treasure hunt…get excitement from finding the next potential beauty queen..
You will see some charts within this site, but the whole point is that you log into your spreadbetting platform, and get used to flicking between weekly, daily, hourly and 10 minute charts yourself. From doing this and paying attention to the comments in this website, you will, with time, generate the right buy and sell trades at the right time.