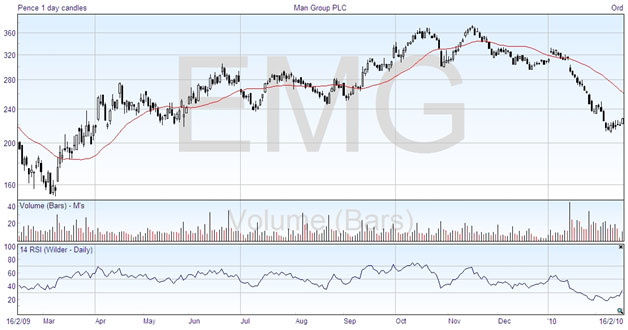
The Relative Strength Index (RSI) is a very popular indicator, and was invented about 30 years ago by Welles Wilder. It works by comparing the stock performance over the past few days, and looking at the average closing prices for up days and down days. It sums up the momentum of the price in either direction. The value is normally arranged to go from 0 to 100, and the extreme lines are placed at 20% or 30% for the oversold, and 70% or 80% for the overbought indication. Here’s an example:

The top chart is the regular candlestick price chart, with a moving average line; in the middle is a volume chart; and at the bottom is the RSI. With most of these indicators, you can customize them to cover different numbers of days, and they are usually set up to default to the common values. In other words, you can use them with the values that they open with, and when you get more experienced you can experiment with changing them. This RSI indicator has a default value of 14 days.
The RSI is similar to many other indicators in that its shape more or less reflects the price chart. In fact, any time an indicator deviates from the price chart direction, it usually means that things are about to happen, and is taken as a warning signal.
Indicators can take extreme values even in the middle of a trend, so an extreme value in itself doesn’t mean that a reversal is about to happen. In describing his indicator, Wilder said you cannot assume that you should trade when the indicator exceeds 70% level, or goes below the 30% level. But what you are generally looking for is a strong move back from the extreme condition, as this usually indicates a reversal of the trend is happening.
For instance, in October 2009 above, the RSI is up at the 70% level, indicating the price may be overbought. It started coming down strongly in mid-October, and you can see that the price followed down, making a good short trade. A similar thing happened in mid-November, although the RSI did not quite get up to the 70% level before coming down. And on the right-hand edge, the RSI indicates that the stock is drastically oversold, but the price doesn’t start increasing until the RSI moves strongly upwards.