If you have any experience of trading, you have probably heard about the head and shoulders reversal pattern. It is perhaps the best known pattern. If you learn how and why this signals a reversal, then you can apply the same principles to several other shapes, some of which are quite similar. So we will look at the head and shoulders pattern in some depth.
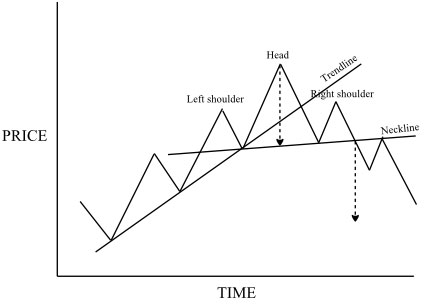
The head and shoulders pattern is so-called because, with a little imagination, it seems to depict a head and two shoulders. Here is a drawing of a perfect example:

The head and shoulders reversal pattern always occurs in an uptrend, though downtrends have their own variation. The uptrend weakens, then falters, and the price reverses into a downtrend. As labelled above, the head is the highest peak, and the peaks each side are called the shoulders. The shoulders are usually at roughly the same height. The trendline drawn on the chart makes clear what is happening.
When the price goes up to the left shoulder, there is no indication of anything other than the uptrend continuing. The price retraces to the trendline, and as expected receives support and goes back up again. You may get some indication of the weakening of the trend when the price rises to the head – it may not rise as high as shown here, and you may see less trading volume, showing that the trend could be in trouble.
But after the peak of the head, it becomes obvious that something is happening. The price drops through the trendline, showing some feebleness to the uptrend, and it also drops below the peak level of the left shoulder, which in normal circumstances would exhibit support in the process of role reversal. While the price goes back up to the right shoulder, this would usually be with lighter volume of trading, and as the right shoulder is lower than the head height, the trend is technically over.
At this point, we can now say that the price is trading sideways. We still don’t know that there will be a reversal. The fall in price from the right shoulder to a point lower than the previous low point now gives us a reason to call it a downtrend – there are two lower highs, the head and the shoulder, and two lower lows. What is called the neckline, connecting the low points either side of the head, now will often provide resistance, as shown, to the next rise in price. If the reversal is strong, the price may not even get back up to the neckline. The reversal is counted is taking place as soon as the price drops through the neckline, as it would otherwise be a sideways trend.
Often, the neckline will slope up slightly, as shown, but it can be level or even sloping downward. The dashed arrows are included to show where you should expect the price to go – it should drop at least as far below the neckline as the distance from the head to the neckline.
While it is not required for the pattern to be valid, the changing volume of trading is a strong indication that the reversal will come. The volume should reduce on each successive peak, indicating that the bullish uptrend is losing momentum, and in particular the volume should be very light up to the right shoulder. Sometimes the volume will increase as the price drops through the neckline reinforcing the change to a downtrend.
What has just been described as a simple weakening of an uptrend, and a change to a downtrend. The pattern itself is not magical, but is a typical price curve traced out during a reversal. However, it does give you a particular form and shape to look for on the chart.
Inverse Head and Shoulders
Not surprisingly, the inverse head and shoulders occurs when a downtrend reverses into an uptrend. It is basically the same as the head and shoulders, but inverted, and the analysis is very similar. Here is the form:
The amount of volume of trading is more important in identifying this pattern than the previous one. Volume does not matter much in a downtrend, but an uptrend you definitely want to see strengthening volume, which would be up from the head and also up from the right shoulder. This confirms that the uptrend is valid and should take over.
Head and Shoulders Variations
As we do not live in a perfect world, you will seldom see such a clean example of the head and shoulders pattern as depicted here. Patterns are typically subject to interpretation, and you have to think about what the price and volume actions are indicating to you.
One variation is called the complex head and shoulders pattern, and this is the head and shoulders pattern but with extra parts. The extra parts could include a double shoulder or a double head. All it really means is that the change from one trend to another is taking a little longer, and the pattern is just as good at marking a reversal.
Sometimes you will get a failed head and shoulders pattern. Even once the price has dropped through the neckline, it is possible that the reversal will fail, and the change of trend not occur. The first indication of this would be the price going back above the neckline, which should not occur once the neckline is broken. Sometimes you can even see the original trend resume. Pattern analysis is not an exact science, and trading will always give you exceptions to any rule.
The head and shoulders pattern can appear to signal a continuation rather than a reversal, although you do not see this as often. You’re not likely to get the two confused, as the head and shoulders continuation occurs in an established downtrend. The result in either case is that the head and shoulders is followed by downtrend, which takes away any ambiguity.