The opposite of reversal patterns, these give you the reassurance that the trend is going to continue, or at most consolidate, rather than reversing. Some of these patterns are just a pause in the flow of the trend, and while they normally continue in the same direction, sometimes they will end in a reversal. But the process of technical analysis doesn’t claim to predict the future, but merely put the odds in your favour.
Triangle Patterns
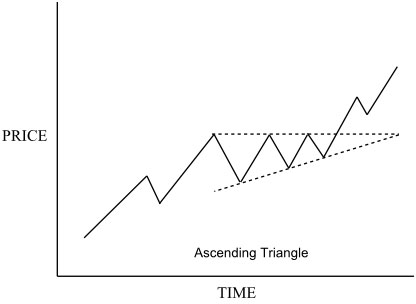
Usually triangle patterns are converging price patterns, and a typical one is the ascending triangle, pictured below:

This is shown in an uptrend, and it represents a slight pause in the trend before it continues. You will usually see it in an uptrend, but it can occur in a downtrend where it is often interpreted as a bottoming pattern, signalling a reverse. Note that the top line is horizontal, and the bottom line rising.
The interpretation of this is that the buyers are being aggressive, and keep pushing the price back up to where it meets a resistance, the horizontal line. Eventually the price breaks through and continues on the uptrend. While the price could break to the downside, it’s unusual because the triangle formation is basically formed by the strong resistance level.
There is an opposite of the ascending triangle, and that is called a descending triangle. The triangle is formed from a descending line above, and a horizontal line below, and the description given above applies in reverse. It is usually seen in a downtrend, and can signal a reversal if it is in an uptrend.
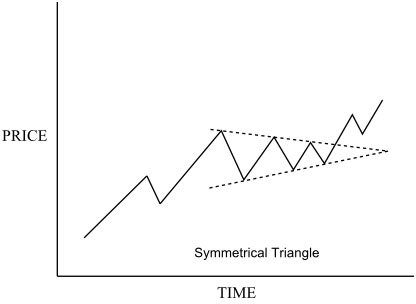
The third type of converging triangle is called the symmetrical triangle, which has the top line descending and the lower line ascending. Here is an illustration of that:

Unlike the ascending and descending triangles, this is a neutral triangle, which doesn’t favour up or downtrends. The odds are that the trend will continue in the same direction when it leaves the triangle, though it does not have a bias in either direction like the other two.
You will often see it, as drawn, with the price bouncing six times off the two sides of the triangle before resuming the trend. Once you have two peaks and two low points, you can draw the triangle and reasonably estimate when the price will break out, which is usually before it is three quarters of the way along. The trading volume is important to confirm the pattern, and usually reduces as the price oscillates, with an upsurge in volume on the breakout.
That leaves the diverging triangle, sometimes called a broadening formation or a megaphone top. With this one, as time goes by the swings up and down get larger and larger, and the volume increases. This shows a lot of hectic activity in the market, and quite honestly is best left alone, though it is usually a bearish pattern.
Flag
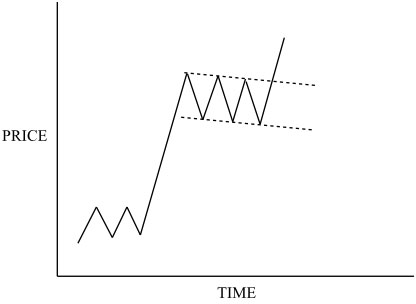
The flag is a continuation pattern, and is fairly short-term, lasting 1 to 3 weeks. This is in contrast to the triangles, which are more usually about one month long. The flag looks like this:

The flag happens in both up and downtrends, usually tilts slightly against the trend, and is a pair of parallel lines. Continuation rather than reversal is very likely, and it is considered one of the most reliable continuation patterns.
There are variations on this with different names. The wedge formation is similar, but the lines converge like a triangle pattern. In an uptrend, it usually slopes downward, and it is a bullish sign. The pennant looks like a symmetrical triangle, again very similar to the flag and with similar characteristics. The difference from the symmetrical triangle is that the pennant comes after a steep rise or fall in price, and is much shorter in duration. Finally, the rectangle formation is again similar to the flag, except the parallel lines are horizontal and it is considered neutral. You need to pay special attention to the supporting volumes of trading for this formation – as you can see, this pattern could easily be a triple top reversal which would have the opposite result.