The previous chart patterns were all to do with the shape of the price curve. Candlestick patterns, in contrast, are to do with the individual candlestick shapes singly and in combination.
First, to put it in perspective, the previous chart patterns have been known and used for many years by Western traders. Although it has been in use for 200 or 300 years in Japan, candlestick charting has only been known to the Western world for less than 30 years. There are perhaps 100 different catalogued candlestick combinations, but they’re based on a few principles which are easy to learn.
Candlesticks in practice show the same information as bar charts, but their format is a little different. It appears to be easier for most spread traders to spot patterns using candlestick charts.
Types of Candlestick
With four prices making up the shape of each candlestick, there is a wide variation in what they look like, and consequently what they can yield in terms of information about the market. The length of the candlestick over the wicks tells us just how wide the trading range was, and the size of the body, which goes from the opening price to the closing price for the day, shows us the progress in the market. Here are various candlestick shapes:

The two candlesticks shown on the left have “long lines”, as the real body is most of the length of the candlestick; the two candlesticks in the middle are called spinning tops, because the body is short but the wick length is long; and the five on the right are types of Doji, a Japanese word, where the body has no length.
As a reminder, the overall length including the wicks at the top and bottom, shows the total range of trading for the day – the highest point and the lowest point. The body goes between the opening price and the closing price, and is white if the price closed higher, and black if the price went down between the open and close. Therefore the long lines showed that there was a big difference between the opening price and the closing price, and the Doji lines, where the real body is represented by a horizontal line, show that the opening and closing prices were the same.
When a candle has a long body, then it is considered to provide a strong indication of the market. A long white body indicates a strong bullish interest, and a long black body is definitely bearish. The body is judged to be long in comparison to adjacent candlesticks, and a true “long line” candlestick will have a body that is two or three times the length of the surrounding candlestick bodies.
The spinning top candlesticks show that there is not so much conviction in the market. As the price did not vary much between opening and closing, there is no overriding force pushing the trend. A particular type of spinning top which has very long wicks above and below is called a high wave candle. This is an indication of indecision, as both buyers and sellers have explored other prices during the day of trading, only to settle back near the starting point.
The Doji candlestick is given great significance in candlestick analysis. It is an extreme form of candlestick, with the closing price coming back to where the day’s trading began. The interpretation of it is that the market is very undecided, with no real direction. If it was a bull market, then closing price would be higher than the open; if a bear market, then the price would have been sure to close down from the open. Therefore the Doji tells us that the buyers and sellers are in balance at this price.
Candlestick Reversal Patterns
Before looking at the patterns, there are three principles to be noted:
- A candlestick pattern on its own is not enough to justify betting, you need to look at other indicators to see whether a reversal is likely.
- Before there can be a reversal, there must be an established trend.
- Most reversal patterns are specific to an uptrend or a downtrend, so you must be sure that the pattern applies.
The simplest patterns are single candles. The Doji in an uptrend is an indication of a likely reversal. The Doji in a downtrend can also suggest a reversal, but is sometimes just a resting place. You can check on this by looking at the volume of trading. If it has been a light trading day, then the trend will probably continue tomorrow.
The Doji where the open and close price is at the top of the wick is called the Dragonfly Doji, and may be an exception to that guideline – it usually suggests a reversal in both an uptrend and a downtrend. The opposite Doji, with the open and close prices at the bottom, is called the Gravestone Doji. This suggests a reversal more strongly when it occurs in an uptrend. Effectively, trading opens, the bulls push the price up during the day, but they are not strong enough to make the price gain stick, and it settles back down at the end of trading. If the bulls have weakened, then it may be time for a downtrend to start.
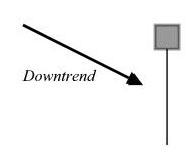
Another popular single candlestick pattern is the Hammer, which is shown below:

I’ve shown the real body as grey, because it doesn’t matter whether it is white or black. The lower wick or shadow should be two or three times the length of the body. The interpretation is that the bearish market lowers the price during the day, but the selling pressure eases and the price comes back up by the close. The bears are losing control of the price, and a reversal may happen.
The same pattern occurring in an uptrend is called the Hanging Man. Again it may signal a reversal, as the trading at a low price could be the start of a selloff, despite the fact that the low price did not stick to the end of the day. A reversal is very likely if the market opens lower on the next day.
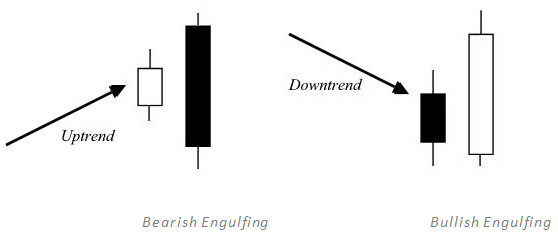
Popular two candle reversal signals include the Harami and the Engulfing patterns. Here are the Engulfing patterns:

It is easy to see why they are called engulfing patterns. The first candlestick is short, indicating a lessening in the strength of the trend, and the second candlestick has a long body, running counter to the trend, which totally engulfs the previous candle.
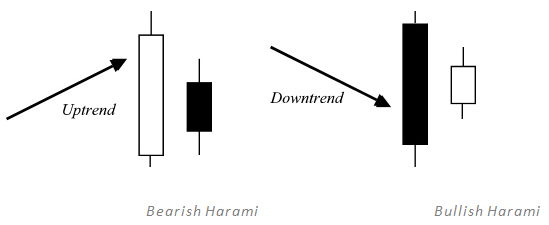
The interpretation of the Harami patterns is the same, despite the fact that the candles seem to have swapped places:

Harami is Japanese for pregnant, so the little candlestick to the right is considered to be the “baby bulge”. While the first candlestick is strongly in the trend, suddenly on the second day the security opens at a lower price and finishes even lower, which can start a sell off.
This has given you a taste of candlestick patterns, and as mentioned there are many more, far more than there is space to include in this guide. All the patterns build on the same principles, with the length of the body signifying strength of the market in the candlestick’s direction, and the length of the wicks adding further information on the volatility. If you’re interested in using candlesticks in your trading, you need to bear the following principles in mind:
- Be sure to use other charting techniques to confirm any indication that the candlesticks are giving you.
- The candle line shows the force behind each move, as well as the price.
- For the candlestick pattern to be valid, it needs to be in the correct trend.
- The candlestick pattern alone is not justification for a new trade.