We perform stock chart analysis to determine when to buy and when to sell our stocks. It also forms part of our stock selection process. A stock may have great fundamentals but if the stock chart isn’t compelling, the stock holds no interest (at that time).
What is stock chart analysis?
Stock chart analysis is the timing component of a complete stock trading method. Without this analysis your trading returns will be at the mercy of the market.
Quite simply, stock prices can only move up, down or sideways.
Ideally, we only want to be holding stocks while they’re going up. But unfortunately, stocks don’t just move in continuous upward trajectories; uptrends consist of a series of up movements followed by sideways pauses – a little bit like a staircase.
What are we looking for?
We’re looking for stocks in strong, consistent uptrends.
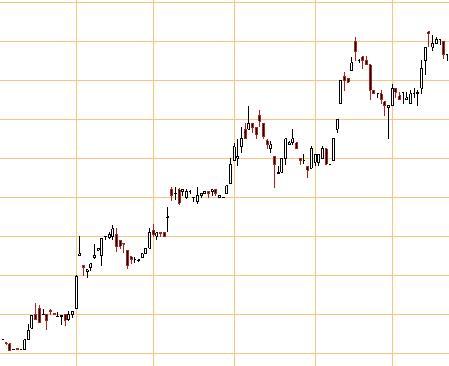
Observe the stock chart below very closely.

You’ll notice that the stock rises for a while, then pauses to take a rest. These pauses are sometimes referred to as “retracements”. This is normal uptrend behavior.
During a retracement, traders are often taking profits (i.e. selling).
When more buying occurs than selling, the price goes up. When more selling occurs than buying, the price goes down. It’s the natural ebb and flow of the market.
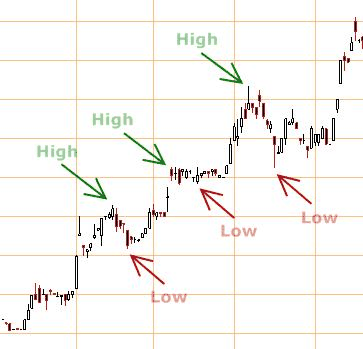
In the chart above, notice that the highs are getting higher and the lows are getting higher. This is the classic definition of an uptrend that you’ll read in text books.
If you look at enough stock charts, and I encourage you to do so, you’ll start to get an intuitive “feel” for how stocks tend to trend. Pay particular attention to the angle of the slope of the overall rising trend and the length and width of the retracements.
Looking at lots of different stock charts on a regular basis, is a great way to develop proficiency in stock chart analysis. It’s well worth the effort, and very satisfying once you get the hang of it.
How will you enter the trade?
A common way of entering a trade is after the price closes above a certain level. That level might be a resistance level, a particular point in a chart pattern, or perhaps a moving average.
I like to enter stocks after they breakout above a “resistance level”.
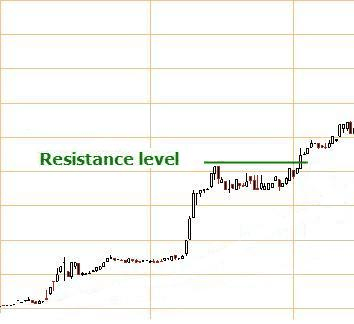
A resistance level is an area on a stock chart where the stock has trouble going higher. This occurs because a lot of selling takes place at the resistance level.
Remember, for the stock to go up there needs to be more buyers than sellers.
At a breakout above resistance, the buyers become much stronger than the sellers. If the resistance level is overcome, then chances are that the stock will continue on to higher prices.
The chart above is fairly typical of a breakout above resistance. The resistance level in this case is the highest price reached prior to the retracement.
For more information on “resistance” (and its close cousin – “support”) go to Support and resistance levels – how to use them
How will you exit the trade?
Trades are usually exited when a stop-loss is hit.
Stop-losses are lines placed on a stock chart at points that indicate that the uptrend is complete and a downtrend (or perhaps prolonged sideways movement) is imminent.
There are two stop-losses to be aware of. Your “initial stop-loss” that prevents you from losing too much money after you initially enter the trade. And a “trailing stop-loss” that follows the stock as it moves upwards.
Commonly used trailing stop-loss methods include:
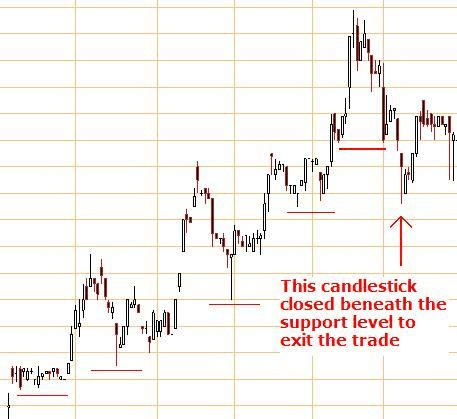
- price closing beneath a support level
- price closing beneath a moving average
- price closing beneath an ATR (Average True Range) stop-loss line
The ATR trailing stop-loss is probably the most efficient, but unless you own a sophisticated stock charting package, you won’t have access to one.
Support levels work very well as stop-loss levels. To learn more about support levels go to Support and Resistance Levels – How To Use Them
Stop-losses based on moving averages aren’t as efficient as the other stop-loss methods mentioned but they can still be used to good effect.
The chart above displays an example of a breakdown below a support level signaling a good time to exit the trade. Shortly after this event the stock entered into a downtrend.
Summary points
- Stocks in strong, consistently rising uptrends make good trading candidates.
- Have your stop-loss strategy sorted out before you enter a trade.
- There is more to trading than has been mentioned here. Before you put money into the stock market you need a trading plan which includes your trading system and money management rules.
- Stock chart analysis is the heart of stock market success
- Continue on to Lesson 5: Business Analysis


