During trending markets you will always have corrections. They are an inevitable part of a trend, and as such provide excellent trading opportunities.
What’s more corrections can often appear as certain shapes and structures that can be seen quite easily to the trained eye, offering similar opportunities time and time again.
One of those familiar shapes or structures is an A-B-C pattern. The a-b-c pattern is quite common and as such has varying names depending on the theory or the analyst using it; however its characteristics are the same.
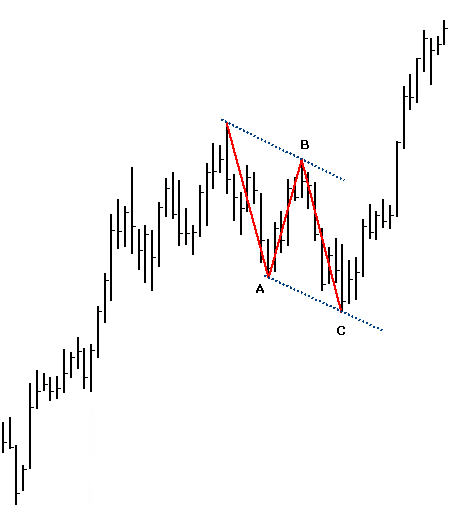
If you are in a trend, the a-b-c pattern will make 3 waves or swings, waves A and C will run counter to the trend, and wave B will run in the same direction as the trend. When the pattern is complete, the main trend will resume.
The a-b-c pattern is never picture perfect, even though traders would love it to be, but two common characteristics that make it easier to trade are the following:
1. Waves A and C will often appear similar in length.
2. The whole pattern will often run within a channel.
If you look at the chart below you can see a nice a-b-c pattern, following the characteristics just mentioned.
The trend is up, and then wave A swings down against the trend, wave B swings back up with the trend, finally wave C swings back down. Also, the lengths of waves A and C appear similar in length, and the whole pattern fits within a small channel.
You won’t always see them appear in such a nice fashion, which can make them harder to trade, however when you do, they offer a great opportunity.
Time asked ‘What time frames should I be looking at to spot these patterns?’
The answer is: Any time frame! The only real consideration is the cost to enter and exit the trade relative to the size of the risk.
For example, if you see an ABC correction on a 5 minute time frame, let’s say on a forex pair, or the E-minis, but the length of the A and C waves are only a handful of pips, your cost to enter is quite large.
