In Part I we looked at how to open up a chart and choose between lines, bars and candles. We also had a look at using different time frames. Today I’m going to show you how I use different time frames to set a trade up.
How I Use The Charts
I’ve been trading for a good few years now and this is how I like to use charts:
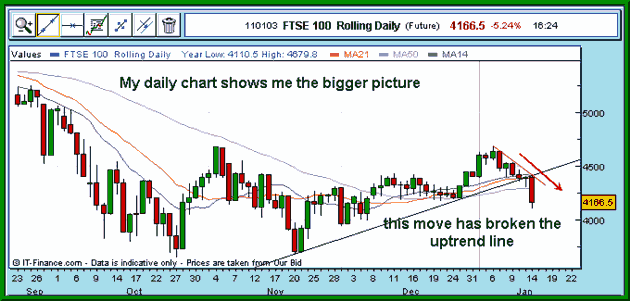
First thing every morning I scan daily charts of the markets that I trade (the major currency and equity markets). I use candles on all my charts so I’m looking for patterns that might show a continuing trend, a reversal, or an amber warning light that things could be about to change. I’m also watching support & resistance lines and key moving averages for signs of a break or change of direction.

As a professional trader I’m trading throughout the day, but the trends on the daily charts are my starting points. I run my trading platform across twin computer screens, which is a huge advantage as I’m able to keep an eye on several markets at a time. I like to keep things simple and find it easier to follow price movements on a chart rather than on the quote screen.
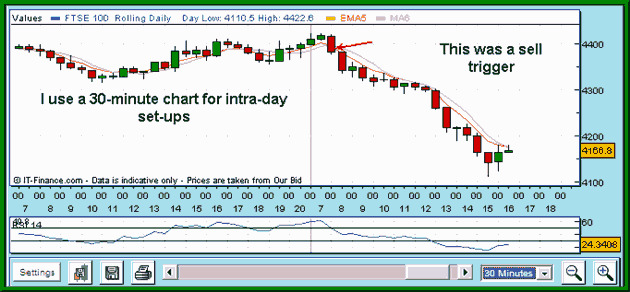
I use different strategies for different markets. For example, I usually trade the FTSE on a 30-minute period (that’s looking at a chart showing a pattern of 30-minute candles over the past week), but a lot of my forex trades come from a 5-minute chart. However, sometimes I’ll be watching a 30-minute and 5 or 10-minute chart of the same market to get a better feel for it.
The chart below shows an example of an intra-day trade; I’ve already decided from looking at the daily chart (above) that I only want to trade FTSE to the short side. My trigger to sell the market is a moving average crossover, combined with the relative strength indicator (RSI) dropping below 50.

This one worked brilliantly (that’s why I used it as an example!), but they don’t always work that well.
Does Technical Analysis Actually Work?
Do you remember the time when you discovered that Father Christmas wasn’t real? Well, best you find out now, there’s no (legal) guaranteed way of making money. Spread betting is about getting the best odds in your favour and yes, I reckon technical analysis helps to improve the odds.
But note the word ‘improve’. No technical analysis is going to be right all the time. And often you’ll be faced with the decision of whether to believe the chart or bow to what’s happening in the real world.
For me, technical analysis has two major benefits:
- Part of the secret of spread betting is keeping the losing trades as low as possible. Yeah, yeah, I’m teaching my gran how to suck eggs. But by paying attention to different patterns, set-ups and measures of extreme movements you can avoid dealing just at the wrong time, or level. The same studies can suggest trades that have a better chance of succeeding than just a random coin toss.
- In order to stay in the game we need to trade like Spock from Star Trek, with no emotions (pointy ears and a camp suit are optional). Picture the scene:
The market’s dropping like it’s going out of fashion. Should you sell now, wait for a bounce and then sell, or buy it for the bounce now? I’ve done it myself plenty of times; you watch it fall, then a bit more. Surely it must bounce. Nope, right I’ll sell now.
“@#!** “, now the market’s bouncing. Should I close out now or wait? I’m losing money; I’ll just wait until it gets back to break-even.
Sound familiar? It will at some point. A system built on technical analysis controls the emotions in trading. Over time you can develop a system that tells you when to place a trade, take profits or close for a small loss. Not only will this give you a better chance of making money, it’ll also save you from needing to buy a bottle of Just For Men and a few extra pairs of trousers.
Which Markets Benefit Most From Technical Analysis?
Technical analysis can be used on all markets; after all, it’s the study of price patterns that have been found to repeat themselves time and again.
But it tends to work better for some markets than others. Equity traders are more likely to pay attention to the key 50-day, 100-day and 200-day moving averages as guidance to longer-term trends. But day-to-day trading will be influenced by company news and earnings projections.
On the other hand, it’s much harder to place a correct value on a currency, although the pointy-heads will argue over purchasing power parity (PPP). On the whole, forex traders will trade a theme (the difference in interest rates, or growth prospects, of two countries), and rely far more on technical analysis to determine where the price is heading and when a trend is coming to an end.
I find that commodities (oil and gold) and equity indexes are a sort of half-way house; traders certainly draw on key technical indicators for guidance, but all these markets are largely influenced by news on the underlying product or shares.