In this article by Dominic . Picarda originally appearing on Horizon’s Trader’s Special the author gives his market projections for the next coming months and provides his personal views on how volatility can be effectively traded.
Volatility has returned to the markets with a vengeance. In the summer of 2011, stock markets around the world plunged more severely than they have since the dark days of the worst of the credit crunch. And the risk of more of the same – or worse – is greater than many realise. But for spread traders, these sorts of dramatic moves can be a terrific opportunity, as long as you’ve got the right tools and the right approach to exploit them.
Because stocks, bonds and commodities have risen so strongly over the last couple of years, the biggest risk – and therefore the biggest opportunity – is if this boom goes completely into reverse. Markets tend to go down faster than they go up, which requires slightly different tactics from traders. Since I see the risks as being heavily skewed towards big falls right now, I’ll focus on how I might play that scenario.
One big threat right now comes from the slowdown in the global economy. Weaker growth naturally means falling company profits, less demand for fuel and metals, and more difficulty repaying loans. All these factors could seriously undermine stock, bond and commodity prices, which as we already know, are at still fairly high levels in many cases.
Of course, it doesn’t pay to be too gloomy. One reason that markets have gone up as strongly as they have since early 2009 is thanks to central banks around the world – and particularly America’s Federal Reserve – creating new money and pumping it into the financial system. A third instalment of this ‘quantitative easing’ (QE) could well be in store before too long. Were another trillion dollars or more to find its way into the markets, it could trigger a further boom and scare the bears away, at least for a time.
Sooner rather than later, further quantitative easing in the US does seem likely. After all, the Federal Reserve has few other options left. As we have already seen over the last two years, this sort of central-bank action can have an awesome impact on asset prices. One difference this time round, however, is that the world economy may be that much weaker than it was during the earlier rounds of QE
In this piece, I’m going to explore some of the main risks facing the USA economy in the coming months.
USA Equities
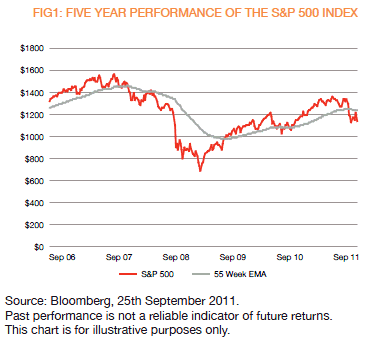
The risk that the US stock market will suffer another full-blown bear market before long is very high indeed. In the summer of 2011, Wall Street came close to suffering a decline of 20 per cent, the most widely accepted definition of a bear market.
However, both history and current circumstances suggest to me that a fall of much greater than 20 per cent could well be in store.
In my view, American equities have been in a long-term bear market ever since early 2000. There have been several periods during the last two centuries where the US market has made no progress for twenty years or so. My research says that now is very likely such a time, and that we are perhaps only halfway through the process. Simply buying and holding stocks clearly does not work in these eras. Instead, I favour a much more tactical, trading approach.
From their lows of 2009 to the peak to date in May 2011, the US stock market more or less doubled. That is a big gain by past standards, considering that we may be in a long-term bear market. Typically, a bull market that occurs during a long-term bear market involves a rise of only about 80 per cent. This terrific rally left US stocks looking expensive in comparison to historical valuations. Using 10-year average earnings, there were only five occasions in the last 140 years that the S&P 500 was more expensive. Each of those occasions gave way to big bear markets.

Should this bear-market scenario prove correct, my preferred trading strategy will be to enter short positions – perhaps via put warrants – around the end of each countertrend rally. During the 2007-2009 bear market, a number of bounces in the S&P 500 index fizzled out at around the 13-week exponential average, which is an objective measure of the average closing price of the S&P 500 over the last 13 weeks. The key difference with the Exponential Moving Average (‘EMA’) as opposed to a simple Moving Average is that the EMA gives more weight to recent data in order to react faster to price changes. The 13 week EMA for the S&P 500 could then be used as one possible level for entering into a short position.
How far could equities fall? Were my more bearish fears realised, I think the S&P 500 could quite easily revisit the 770 region that it reached in both 2002 and 2008-09. I am by no means the gloomiest of commentators here. Stock-market historian Russell Napier has predicted that the S&P might drop to as low as 400.
Despite the currently poor technical and fundamental outlook for US equities, there is more than a glimmer of hope. Quantitative easing could help to bolster the market, both in America and further afield. In this event, I might well have to have a serious rethink of my bear-market case. Ultimately, though, further monetary machinations are only likely to postpone the day of reckoning, and also make the eventual unravelling more severe than it otherwise would have been.