Gaps
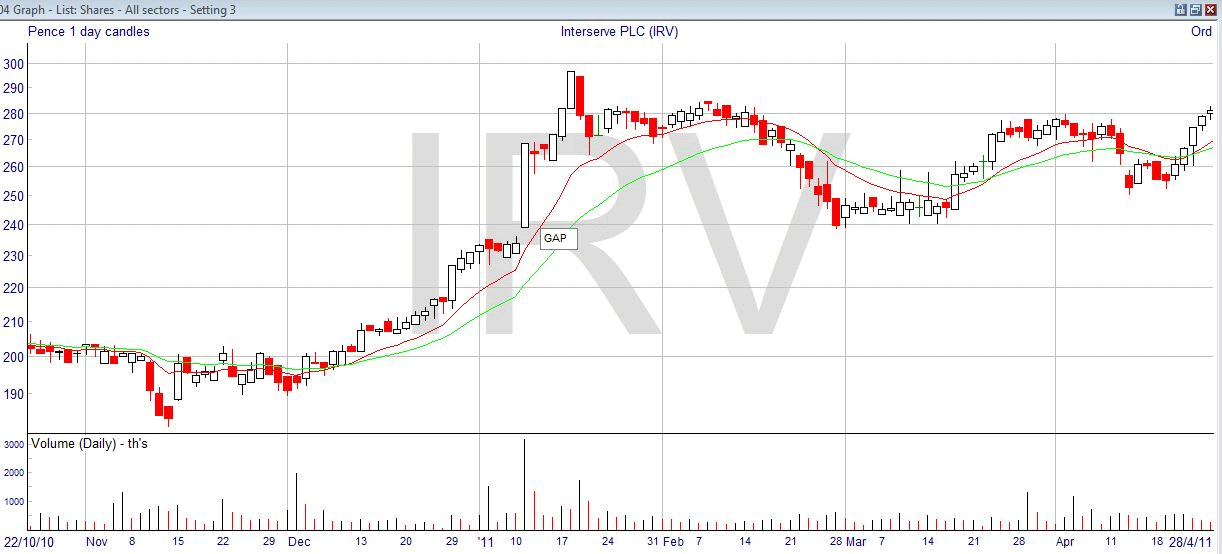
First, let’s deal with gaps, or “windows” as they are called by Japanese candlestick chartists. Gaps are spaces in the price chart where no trading has taken place – the price has just jumped from one number to another. Almost invariably, you will see them between two adjacent days. The second day opens at a price that was not traded on the previous day, and continues from there. For it to be a gap, there must be a price range which has not been traded between the two days. Here’s an example of a gap : –

In this case, the gap occurred in January 2011, and as you can see was accompanied by a high volume (shown on the lower bar chart). This is typical of this type of gap. Possibly there was some company news which caused this “gap open”, and you can see from the length of the candle and the absence of a wick on either end that on this day prices rose strongly from start to finish.
If you’ve been looking at trading, you may have heard the expression that “gaps are always filled”, meaning that the price will always come back at some stage to trade in the range of the gap. That is not true, and depends on the type of gap that you are looking at. Some types of gap will usually get filled, and others won’t. The three types of gap are the breakaway gap, the runaway gap, and the exhaustion gap, and we’ll look at each in turn.
Firstly, the breakaway gap. This type of gap you will see when there is a strong breakout from an existing price pattern. It’s basically a sign of strength, and you will usually see greatly increased volume. You might see this when you have been identifying a reversal pattern, and waiting for it to resolve. This is the type of gap shown above. You shouldn’t hold your breath waiting for this gap to be filled, as it’s unlikely to happen any time soon, particularly in the case above with the high volume of trading. In fact, if the gap is filled it’s a sign that the breakout has failed.
However, if the price does come back down to the gap it quite often forms a support (or resistance if in a down-trend). You can see exactly that in the chart above, where the price is heavily supported just below 240 for several weeks in March before going back up again.
The second type of gap is called a measuring gap or a runaway gap, and it is a good sign that you will see in a strong trend. It often happens around the middle of the move, which is why some analysts call it a measuring gap, estimating that the price has gone about half of its total ultimate distance. It shows a good flow in the trend, and again probably will not be filled by any imminent price action. It might also act as a support or resistance, because if filled it would be a sign of weakness in the trend. Incidentally, you can sometimes see a series of these in a trend, so it’s not necessarily half way; but that would show a very strong trend.
The third type of gap is the one that is likely to be filled. It’s called the exhaustion gap, and it happens when the trend is running out of steam. Sometimes at the end of a trend there will be a desperate leap forward by the price, creating a gap, but it is likely that the price will fall back to it soon. When the price drops below the gap, it’s usually a sign of a reversal.
You can also see the first and last types of gap together, and this has a special name of an “island reversal” pattern. First you would see an exhaustion gap at the end of a strong trend, commonly followed by the price trading sideways. Then a reversal gap starts a trend in the opposite direction, leaving the sideways price action as an “island” with the gap on each side.