You may have noticed that most of the techniques we’ve covered were invented a century or more ago, even though the Japanese based ones have only been known to the West for a few decades. Really, that’s only to be expected, as the markets have been around for ages, and as long as human resources could achieve it, then systems to try and improve forecasting would be developed. Ichimoku has just been discovered in the West in the last couple of years, so you might be tempted to think that it is a new development. Comparatively, this is so, and indeed there are several people actively working on enhancements, but again the Japanese were far ahead of the West, and were drawing the charts by hand in the 1930s. Having said that, it was only 1968 when the techniques were openly published in seven volumes in Japanese.
The full Japanese name for this charting method is Ichimoku Kinkho Hyo, but it can also be called the more manageable Cloud Charting in the West because of its appearance. The Japanese translates as Ichimoku – at a glance; Kinkho – balance; and Hyo – bar chart. In other words, equilibrium charting where the message of the chart can be seen at a glance. There are some other Japanese words used to describe the method which I’ll mention as we go along, but the names are much less important than the meanings.
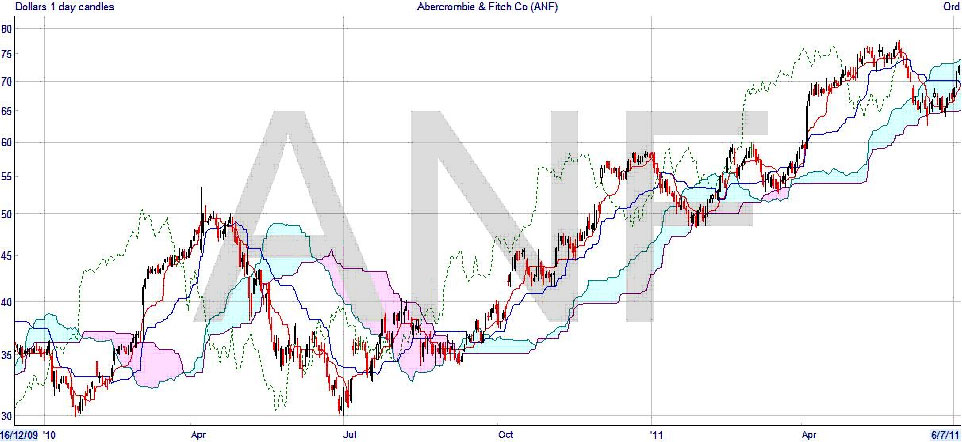
When you first see a cloud chart, you may wonder why it merits the name “at a glance” as it looks so complicated, but once you become familiar with it you will learn to appreciate the power of the technique. In fact, it is in essence a simple charting method, and should grow in popularity. There are several ways in which the charts can be used, and several different elements to the drawing, and it certainly helps that computers are available to produce the charts. With that preamble, here is your first sight of an Ichimoku chart: –

You can see that underlying the lines and shaded areas is a candlestick chart, which is drawn in the normal way. But there are several other lines, which we’ll look at one by one. The first thing to note is that all the lines are derived from the price information only, and there is no volume needed, so they can be drawn for all markets including Forex.